1997 First-Year Students' Profile
Table of Contents
- Summary
- Introduction and Methodology
- Demographics of the First-Year Class and Survey Respondents
- Background Information
- Marketing Research
- Educational Intent and Interests
- Goals for Undergraduate Education
Tables for NC State Respondents
- Background Information
- Marketing Research
- Educational Intent and Interests
- Goals for Undergraduate Education
Tables for College Summaries
- Background Information
- Marketing Research
- Educational Intent and Interests
- Goals for Undergraduate Education
Return to OIRP Survey Page
Return to OIRP Home Page
Office of Institutional Planning and Research, December 1997
Philip Handwerk, Graduate Research Assistant
Denise Gardner, Coordinator of Survey Research
Summary
This report presents information regarding the demographics, background,
marketing information, educational interests, and educational
goals of the 1997 entering first-year students at NC State. No
significant differences were found between the survey group and
the broader population of registered students; thus, the results
may be regarded as representative of the entire first-year class.
Marketing Research
Background and Interests
Goals for Undergraduate Education
The remainder of this report is organized into the following categories:
introduction and methodology, demographics, background information,
marketing research, educational intent and interests, and goals
for undergraduate education.
Purpose
This report presents a profile of the 1997 entering first-year
students at NC State. As in previous studies, it is based on responses
to a survey that is given during the summer and fall orientation
sessions. This report includes students entering into all 11 undergraduate
academic units, including the Agricultural Institute and the First
Year College.
Description of Sample
A total of 3,626 first-year students attended these orientation
sessions. Of this total, 3,157 surveys, which represent 83.2%
of the 3,796 first-year students who registered for the fall 1997
semester, were usable for this report. Tests of statistical significance
revealed no significant differences between the survey group and
the broader population of registered students (gender, Chi-sq.
0.02, df=1, p>0.01; ethnicity, Chi-sq. 4.14, df=2, p>0.01;
academic unit Chi-sq. 18.58, df=10. p>0.01). Thus, the
results obtained from analysis of the responses may be regarded
as broadly representative of the entire group of entering first-year
students. Significant differences were found in answers to some
questions, however, when gender, ethnicity and academic unit were
considered.
Methodology
The data obtained from the first-year orientation sessions were
analyzed using standard statistical methods. Responses were tested
to determine whether there were significant differences when gender
or ethnicity were considered. Analysis was also done across baccalaureate
academic units. However, only those differences regarding influential
factors and developmental goals are addressed in this report.
All questions requiring categorical responses were analyzed using
chi-square tests, and all questions with numerically coded responses
were analyzed using either T-tests or one-way analysis of variance
(ANOVA) with Duncan's multiple comparison procedure.
In tests of statistical significance, p values of 0.01 or less
were considered to indicate significant differences. For tests
that report an exact p-value (chi-square, T-test), the exact p-values
are specified in the discussions when practical. Duncan's procedure
does not report an exact p-value, so in this case it is reported
as less than or equal to the specified significance level of the
test (in this case, alpha = 0.01). To make identification of significant
results easier, the category of significant responses as well
as an approximate p-value (p < 0.01) appears below the
corresponding table or chart.
The first-year class of 1997 numbered 3,650 four-year enrollees
plus 146 enrollees in the Agricultural Institute (two-year program)
for a total of 3,796 fall enrollees. The total number of usable
surveys from the orientation sessions was 3,157 (83.2% of total).
The breakdown of the first-year class by gender was: 40.1% female
and 59.9% male; and by ethnicity: 81.3% white, 12.1% African-American,
and 6.6% other minorities. Demographics by gender and ethnic group
are found in Table 1.
Table 2 presents enrollment of first-year students as well as
survey respondents by academic unit. The largest percentage of
first-year students enrolled in the College of Engineering (27.3%)
and First Year College (24.4%). The smallest percentage of first-year
students enrolled in the College of Education and Psychology (2.4%)
and School of Design (2.4%).
Statistics for Fall 1997 first-year bachelor's degree students
are shown in Table 3. The mean total SAT for all students was
1,154, which is comparable to the 1996 first-year mean of 1,149.
Highest mean scores for SAT Total scores were found for students
enrolled in the College of Physical and Mathematical Sciences
and the School of Design. Physical and Mathematical Sciences and
Design students also registered the highest Admissions Index (AI).
Design students recorded the highest High School Grade Point Average
(HSGPA).
The HSGPA remained relatively unchanged in 1997 at 3.69, after
climbing to 3.65 in 1996 from 3.56 in 1995. The overall AI rebounded
somewhat to 2.84 from 2.77 in 1996 and 2.93 in 1995. A mixed trend
exists over the past seven years for SAT Total scores, although
scores have risen slowly since 1994.
This section presents background information about first-year
students, including whether they receive financial aid, information
about their households, employment plans, and other personal information.
First-year students indicated whether or not they are receiving
any type of financial aid including work study, grants, loans,
and scholarships. The majority (57.8%) denoted that they are receiving
some sort of financial aid, although significant differences occurred
across ethnic groupings (p=0.001). Most African-Americans (85.8%)
indicated obtaining financial aid, while 55.1% of other minorities,
and 54.4% of whites agreed. Table 4 below examines the various
types of financial aid given across gender and ethnicity. Note
that in all but the Other (dance, music, etc.) category, there
existed a significant difference among ethnic groups.
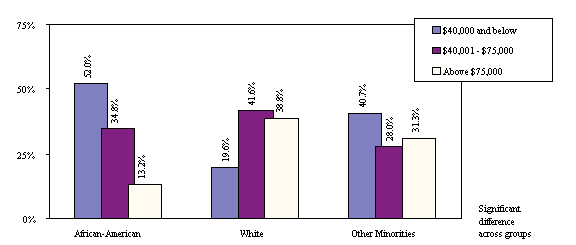
Students indicated the combined pre-tax income of their parents/guardians
for 1996. Most students denoted that they come from middle to
upper-middle class families. The plurality of students (40.0%)
marked their family's income to be between $40,001 and $75,000.
Better than one in three (35.5%) came from households with incomes
greater than $75,000, while 24.5% marked incomes of $40,000 or
below. When viewing income across ethnicity, significant differences
occurred (p=0.001). Most African-American students marked their
parent/guardian incomes to be either $40,000 or below, or $40,001-$75,000.
White students divided more evenly between the $40,001-$75,000
grouping and above $75,000, while other minority students resided
equally in all three income classifications (see Chart
1).
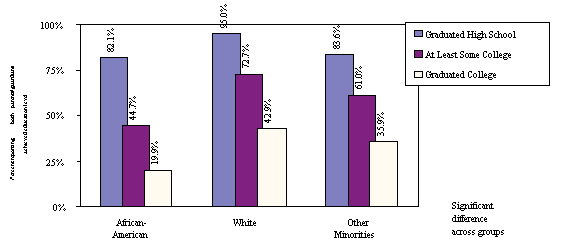
Over one-third of all students surveyed (39.9%) reported that
both of their parents/guardians graduated from college, and two
out of three (68.8%) said both have at least some college education.
Fathers/male guardians (59.7%) were more likely than mothers/female
guardians (51.4%) to have earned bachelor's degree or higher.
However, mothers/female guardians were more likely to have at
least some college education (28.6% vs. 22.5% fathers/male guardians).
Significant differences occurred between ethnic groups (p=0.001)
for both parent/guardian education levels. The majority of white
and other minority students reported that both their parents/guardians
experienced at least some college education. Just under half of
the African-American students (44.7%) indicated that both parents/guardians
received education beyond high school (see Chart 2).
Two-thirds of survey respondents indicated they came from households
with four or more persons. Significant differences (p = 0.001)
were found when ethnic groups were considered. A larger percentage
of African-American than white and other minority students indicated
they lived in households supporting either one or two persons.
Most of the first-year students (68.5%) reported that they were
the only dependent in their family household who was enrolled
in college at the time of the survey. Significantly greater (p=0.001)
percentages of African-American students indicated they were the
only dependent in their household currently enrolled in college.
The first-year students surveyed reported that they came to NC
State from a wide variety of population densities. The greatest
percentage indicated that they went to high school in moderate
cities (29.2%) or in small towns (24.6%). A considerable percentage
said they hail from rural areas (18.4%) and urban areas (16.0%),
while 11.9% resided in large cities. Significant differences occurred
across ethnic groups (p=0.001), although the distribution remained
relatively unchanged. Those students in the other minority group
indicated more often that they went to high school in urban areas.
Whites and African-Americans reported in greater percentages that
they attended rural high schools.
Most first-year students (52.2%) indicated that they believed
their high schools "adequately" prepared them for college.
One-third reported that they felt to be "well prepared"
by their high schools. Female students reported being "well
prepared" significantly more often than did male students
(p=0.002).
The majority of respondents (60.5%) also denoted that they thought
they had "adequately" prepared themselves for college.
Over one-third said they had "well prepared" themselves.
Again, the female students significantly more often (p=0.001)
reported being "well prepared" through their own efforts
than did the male students.
Almost all (97.2%) first-year students reported having no dependent
children. Significant differences (p = 0.001), however, were found
when ethnicity was considered. A larger percentage of African-American
than whites and other minority students indicated they had at
least one dependent child. Of those with children, the greatest
number had children in the secondary age group or older (n=23),
while 12 students recorded that they had infant children of their
own.
Overall, the students surveyed reported a wide variety of religious
and denominational preferences. One-third of the respondents said
they are Baptists, and roughly 15% each said they are Methodist
or that they have no preference. First-year students indicated
their religious preferences with significant differences between
both ethnic groups (p=0.001) and genders (p=0.001).
Disabilities of First-Year Students
Few first-year students reported having any disabilities. However,
significant differences (p=0.003) did occur among ethnic groups:
more white students (2.8%) than African-American (0.3%) or other
minority students (0.5%) said they have a learning disability
or Attention Deficit Disorder.
First-year students indicated whether they played any of the instruments
from a list of nine. Only a small percentage of students responded
'yes' to these questions, with the highest percentage (8.2%) denoting
that they played clarinet/saxophone. For nearly every instrument
listed, significantly more females than males indicated they played
that particular instrument.
Nearly all first-year students (97.1%) indicated that they had
not received any level of ROTC training. However, significantly
more (p=0.001) African-American students said they received ROTC
training in high school.
Intended Work Community
First-year students marked with the greatest frequency (43.5%)
that when they graduate they will seek employment anywhere, that
location was not an important factor to them.
Ethnic groups differed significantly (p=0.001) on this issue as
well. White students reported a greater interest in staying in
North Carolina upon graduation than did either of the other two
groups. Other minority students and African-American students
indicated a greater willingness to go anywhere than did white
students. Significant differences were also found by gender (p=0.003).
Males said they were more interested than females in seeking employment
outside of NC but in the US.
Marketing research concerns the experiences new students had with
the application process, and also examines those factors students
considered influential in their decision to attend NC State.
Factors Influencing Attendance Decision
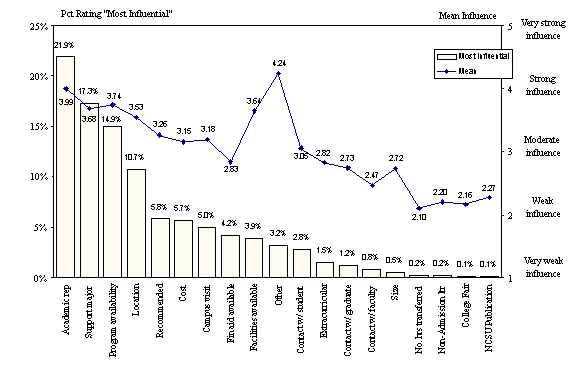
First-year students indicated the extent that any of nineteen
factors influenced their decision to attend NC State. The scale
used was: 5 = Very Strong Influence, 4 = Strong Influence, 3 =
Moderate Influence, 2 = Weak Influence, and 1 = Very Weak Influence.
Respondents recorded that academic reputation had the strongest
influence on their decision to attend NC State (see Chart 3).
They additionally indicated that availability of program,
support for my intended major, facilities and resources
available, and location had strong influences on their
decision. A second tier of influence contained the factors recommended
by a friend, family member, teacher, counselor, etc., campus
visit prior to orientation, cost, and contact with
a current student. Few first-year students considered publications
from NC State, letter from someone other than Admissions
Office, attendance at a College Fair, or number
of hours transferred to be important influences in their decision
to attend NC State. Factors that respondents frequently listed
in the "other" category varied but included: athletics,
having a reputable (specific name) program, the university having
a friendly environment, always wanted to attend NC State, and
have friends here.
When examining responses by gender, it was discovered that the
female students tended to rate nearly all of the factors as more
influential than did the male students. However, male respondents
and female respondents differed significantly (p=0.001) on only
a few factors. For each of the following, females rated the factor
as having greater influence: location, size, campus
visit prior to orientation, and contact with a current
student.
Students rated most factors significantly different (p <
0.01) when looking across ethnic groups. In all but one instance
where there were significant differences, African-American students
rated the factor as more influential than whites or other minority.
The only significantly different factor where African-American
students rated the influence lower than another group was on the
factor of cost. Other minority students regarded cost
as more influential than did either African-American or white
students.
An ANOVA was run for this question, looking for significant differences
among the baccalaureate academic units. On every factor except
for number of hours transferred/credited, contact with
a graduate, attendance at a College Fair, and other
students from various baccalaureate academic units significantly
differed (p < 0.01) in their influence ratings.
Educational intent and interests concern students' majors, course
load, and extra-curricular interests.
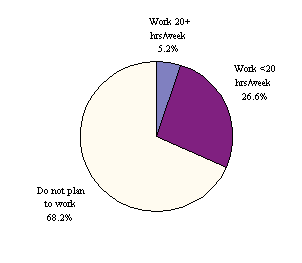
Plans to Work
About one-third of the students (31.8%) marked that they intend
to work during their first semester (see Chart 4).
Student Affairs
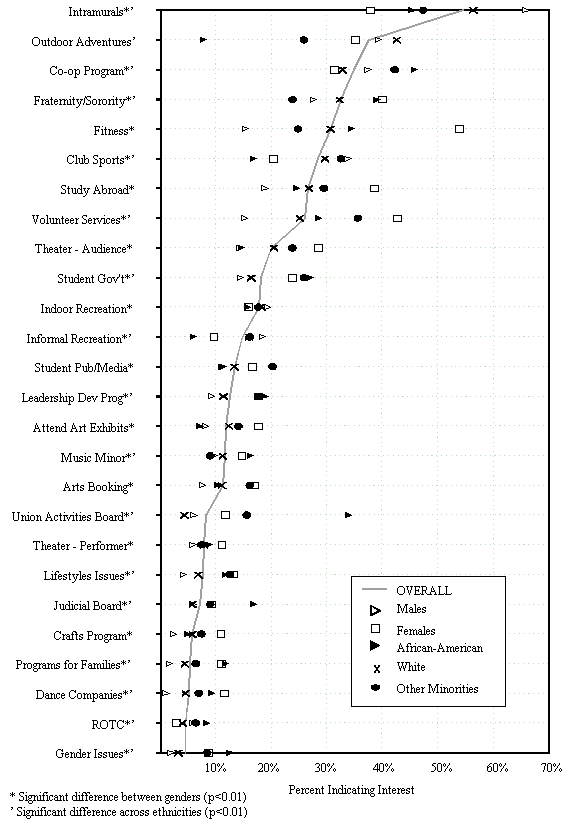
First-year students indicated their interest in 26 programs and
activities. The highest percentage of respondents indicated an
interest in intramurals. Males tended to express more interest
in recreational activities while females more often pursued non-recreational
activities. African-American students expressed more interest
in Union Activities Board and Judicial Board. Other
minority students indicated significantly more interest in volunteer
services, and student publications/media, while white
students marked more interest in intramurals and outdoor
adventures (see Chart 5).
First-year students rated their current level of development and
importance of goals concerning students' general educational,
personal development, and world view goals.
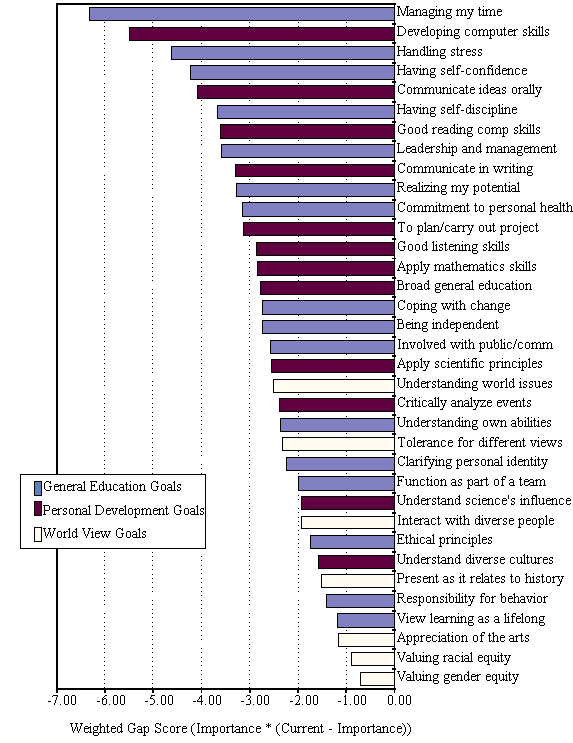
Weighted Gap Analysis
A weighed analysis was conducted of the gaps between students'
current level of development and the importance they attributed
to each of the goals. Initially, the mean score for the importance
of a particular goal was subtracted from the mean of that goal's
reported current level of development, resulting in the difference
between where the student is now (current level) and where they
hope to be (importance). The outcome of this process yielded negative
scores for each goal. Therefore, for each goal the first-year
students hoped to develop beyond their current levels.
Next, the gap was multiplied by the mean importance score given
the particular goal creating a weighted gap score. This weighted
gap score not only took into account how far apart present development
and desired development were, but also how meaningful that gap
was to the student. For example, consider two goals with a gap
score of -1. The first goal had a current level mean of 1 and
importance mean of 2. The second goal's current level was 4 with
an importance of 5. Clearly, the population regarded the second
goal as more important and thus should be considered over the
first goal, even though they had identical gap scores.
When viewing Chart 6 it is not as important what the weighted
score is, but the focus should be given to the length of a goal's
bar relative to the other goals. According to the analysis, the
first-year students would place a priority on addressing the goals
of: managing my time, developing computer skills,
and handling stress. Three of the top five weighted gaps
concern general education goals. Goals involving personal development
tended to cluster more towards the middle of the 35 issues, while
the world view goals generally filtered out as the lowest priorities.
African-American
Asian
Hispanic
Native American
White
Total
Agriculture and Life Sciences (Bachelor's)
Design Education and Psychology
Engineering First Year College
Forest Resources Humanities and Social Sciences
Management Physical and Mathematical Sciences
Textiles Subtotal Agricultural Institute (Two-Year)
Total
Agriculture and Life Sciences (Bachelor's)
Design
Education and Psychology
93
Engineering
1037
First Year College
925
Forest Resources
98
Humanities and
Social Sciences
294
Management
233
Physical and
Mathematical Sciences
128
Textiles
138
Overall
Basis of aid (%)
Financial need ++
54.7 29.5
34.9 32.6
Academic ++
36.8 28.8
26.7 29.6
Other than listed ++
17.7 9.5
9.2 10.4
Athletic-based ++
5.1 1.8
0.5 2.1
Other (dance, music, etc.)
0.9
1.0 0.5
0.9
Link to Detailed Marketing Research Report
Link to Detailed Educational Intent Report
Link to Detailed Goals Report