North Carolina State University
1998 Graduating Senior Survey
![]()
North Carolina State University
1998 Graduating Senior Survey
The University of North Carolina General Administration (UNC-GA) has developed a system of student surveys to help evaluate institutional performance. During the spring 1998 semester, all sixteen UNC campuses conducted a survey of graduating seniors. NC State surveyed those seniors who were enrolled in the Spring 1998 semester and had applied to graduate as of March 30, 1998.
No significant differences by gender, ethnicity, or academic unit were found between NC State�s survey group and its broader population of students; thus, the results may be regarded as representative of the graduating seniors as defined above. This report presents information regarding the demographics, profile, assessment of faculty contributions and academic environment, satisfaction with services for students, knowledge and skill development, and evaluation of campus climate from seniors at NC State in the spring of 1998.
Profile of RespondentsThe remainder of this report is organized into the following categories: introduction and methodology, profile of respondents, faculty contributions and academic environment, services for students, knowledge/skills/personal development, and campus climate. More detailed analysis can be found on the Office of Institutional Planning and Research Survey Research web page: https://isa.ncsu.edu/srvy. Analyses available include separate reports on faculty contributions and academic environment, services for students, knowledge/skills/personal development, and campus climate, as well as supporting data analysis tables and comparisons with other UNC system institutions.
The purpose of the 1998 Graduating Senior Survey was to gather information on the undergraduate experience at NC State from seniors who had applied to graduate as of March 30, 1998. Questions concerning students� assessment of faculty contributions and academic environment, satisfaction with services for students, knowledge and skill development, and evaluation of campus climate are summarized in this report.
Description of the SampleThis report presents a profile of seniors who were enrolled in the Spring 1998 semester and had applied to graduate as of March 30, 1998. Note that this population definition is different than in previous years. Due to UNC General Administration�s mandates, this population may include some seniors who did not actually graduate in May, and may exclude a few seniors who applied to graduate after March 30th.
The sample consisted of 1,094 survey respondents, which comprised 53.9% of the population of 2,028 spring 1998 seniors who had applied to graduate as of March 30, 1998. Chi-Square tests (at the 0.01 significance level) for sample representativeness by gender, ethnicity, and academic unit revealed no significant differences between the survey group and broader population. Thus, the results obtained from analysis of the responses may be regarded as broadly representative of the graduating seniors as defined above. Significant differences were found in answers to some questions, however, when gender, ethnicity, and academic unit were considered.
MethodologyThe data obtained from the 1998 Graduating Senior Survey were analyzed according to standard statistical methods and practices. Forced-choice responses were tested to determine whether there were any significant differences according to students� gender, ethnicity, and academic unit. Questions with categorical responses were analyzed using chi-square tests, while questions with numerically coded responses were analyzed using either T-tests or one-way analysis of variance (ANOVA) with Duncan�s multiple comparison procedure. The significance level for all analyses was p< 0.01. Analyses were calculated omitting responses of "don�t know" and "did not use" to portray the most accurate picture of students� attitudes and opinions.
Responses to two broad, open-ended questions were transcribed verbatim, and then examined for relevant themes. To represent and illustrate themes, student quotes are included throughout this and the other reports. Both open-ended and forced-choice responses are discussed in conjunction with each other.
This section provides a profile of respondents to NC State�s 1998 Graduating Senior Survey by describing seniors� demographic composition, employment while attending NC State, plans after graduation, and other areas.
The Graduating Senior Class Compared to the Sample of RespondentsIn the table below, the demographic composition of the population is compared to the survey respondents. Frequencies and percentages by ethnicity and gender are displayed. Graduating seniors were mostly white (86%) and male (55%), with almost half of seniors (49%) both white and male. Chi-Square analyses indicated that for gender and ethnicity, the sample of survey respondents did not significantly differ from the population of the senior class.
|
Graduating Senior Class * |
Survey Respondents |
|||||
|
Ethnicity |
Female |
Male |
Total |
Female |
Male |
Total |
|
African-American |
90 4.4% |
56 2.8% |
146 7.2% |
41 3.7% |
26 2.4% |
67 6.1% |
|
Other Minorities |
73 3.6% |
73 3.6% |
146 7.2% |
36 1.8% |
42 2.1% |
78 3.8% |
|
White |
743 36.6% |
993 49.0% |
1736 85.6% |
404 36.9% |
545 49.8% |
949 86.7% |
|
Total: |
906 44.3% |
1,122 55.3% |
2,028 100% |
481 44.0% |
613 56.0% |
1,094 100% |
Table 2 displays the population and sample by academic unit. The college with the most seniors who had applied to graduate was the College of Engineering (COE), 24%. A breakdown for the other academic units at NC State are also listed in Table 2, including the College of Agriculture and Life Sciences (CALS), the School of Design (DESIGN), the College of Education and Psychology (CEP), the College of Forest Resources (CFR), the College of Humanities & Social Sciences (CHASS), the College of Management (COM), the College of Physical and Mathematical Sciences (PAMS), and the College of Textiles (COT).
|
College or School |
Graduating Senior Class * |
Survey Respondents |
||
|
Agriculture and Life Sciences |
N = 378 |
19 % |
n = 191 |
17 % |
|
Design |
68 |
3 % |
22 |
2 % |
|
Education and Psychology |
140 |
7 % |
69 |
6 % |
|
Engineering |
492 |
24 % |
313 |
29% |
|
Forest Resources |
87 |
4 % |
45 |
4 % |
|
Humanities and Social Sciences |
368 |
18 % |
179 |
16 % |
|
Management |
278 |
14 % |
145 |
13 % |
|
Physical and Mathematical Sciences |
92 |
5 % |
53 |
5 % |
|
Textiles |
125 |
6 % |
77 |
7 % |
|
Total: |
N = 2,028 |
100 % |
n = 1,094 |
100 % |
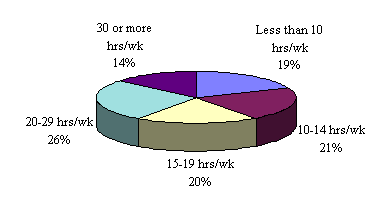
Roughly 83% of survey respondents reported being employed while attending NC State. Of these students 19% worked less than 10 hours per week, 41% worked 10-19 hours per week, and 26% worked 20-29 hours per week. There were no significant differences in hours worked by gender or ethnicity.
Hours Worked Per Week During the Past Academic Year
Sixty five percent of working students indicated that their jobs while attending NC State were directly related (36%) or somewhat related (29%) to their academic major. Of the 35% who had held jobs not related to their major, two-thirds indicated that working in an unrelated field was by choice.
For students who indicated that their jobs were related to their academic major, there was no significant difference by ethnicity, but significantly more males than females had jobs that were related to their academic major. Additionally, there were significantly more students in the College of Textiles (COT) and the College of Humanities and Social Sciences (CHASS) that said their job while attending college was not related to their major.
Field ExperienceOf the 56% of respondents who indicated that their major included some type of field experience, the vast majority (95%) indicated that the experience contributed positively to their personal and professional growth. Thirty-five percent of participants had received job offers directly from their field experience employer. Significantly more students in the College of Physical and Mathematical Sciences (PAMS) and the College of Management (COM) said their major did not include any type of field experience.
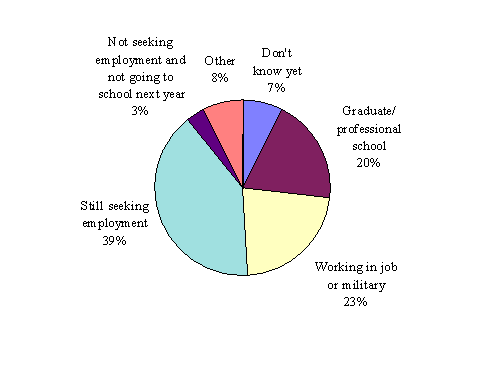
Plans After GraduationRespondents generally made career-oriented plans following graduation, and most seniors planned to join the labor force immediately. Twenty-three percent of respondents indicated that they had already secured employment or were entering the military and 23% of respondents were planning to go to graduate or professional school. However, 39% were still seeking employment at the time of the survey. Significantly more males than females had already accepted jobs.
Plans After Graduation
Seventy-nine percent of graduating seniors said if they could begin their undergraduate education again they would choose NC State, and 80% would choose the same major. There were significant differences by academic unit. Significantly more students in the College of Textiles (COT) and the College of Agriculture and Life Sciences (CALS) indicated that they would not choose the same major again.
 Tables by Gender/Ethnicity
Tables by Academic Unit
Tables by Gender/Ethnicity
Tables by Academic Unit
FACULTY CONTRIBUTIONS AND ACADEMIC ENVIRONMENT
Graduating seniors were asked to rate the extent to which NC State had contributed to educational areas such as faculty contributions, quality of instruction, intellectual environment, and overall education.
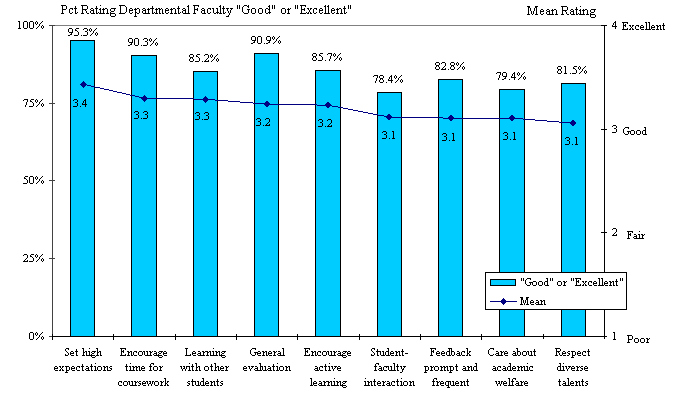
Faculty contributions generally received high ratings, with 91% rating faculty contributions overall as "good" or "excellent". The lowest ratings were given for the faculty�s concern about the student�s welfare (79%) and for student-faculty interaction (78%).
Faculty Contributions
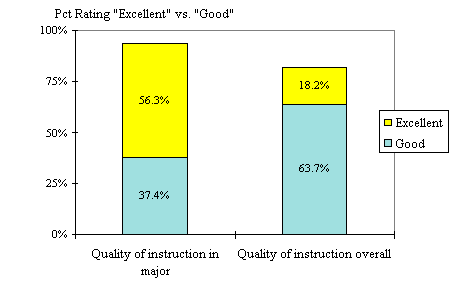
Over 90% of students felt that the quality of instruction in their major was "good" or "excellent" and over 80% felt that the quality of instruction overall was "good" or "excellent". However, over 50% of respondents felt that quality of instruction was "excellent" in their major, while only 18% of respondents felt that the quality of instruction overall was "excellent".
Quality of Instruction
75% of respondents felt that NC State�s intellectual environment was either "strong" or "very strong". There were no significant differences by ethnicity or gender. There were significant differences by academic units: the majority of the respondents in each college, with the exception of the School of Design, indicated positive responses to the intellectual environment at NC State.
Overall Education Received at NC StateOver 90% of respondents felt that overall, the education they had received at NC State was "good" or "excellent". There were no significant differences by ethnicity, gender or academic units.
Detailed Faculty/Academic Report
Tables by Gender/Ethnicity
Tables by Academic Unit
NC State offers a wide variety of university services to students, including academic advising, employment assistance, campus resources, and extracurricular opportunities. Graduating seniors were asked to assess satisfaction with these services based on their last two years on campus.
Items were rated on a four-point scale ranging from 4 = "excellent" to 1 = "poor". A "don�t know/did not use" option allowed respondents to indicate if they were not aware of or had not used the service. The charts in this section show the responses in decreasing mean score order, and do not include the "don�t know" responses.
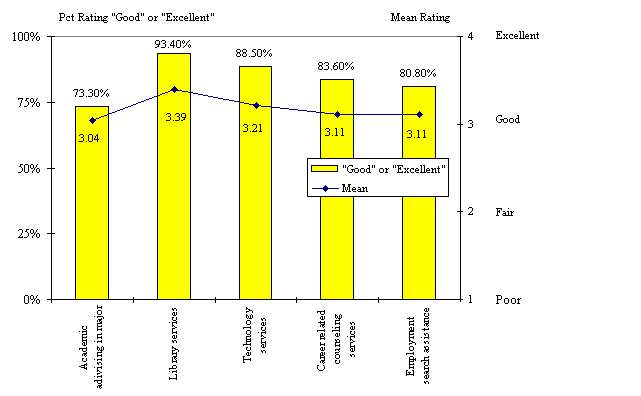
Academic ServicesLibrary services received the highest overall rating, with 93% of respondents indicating that library services were "excellent" or "good". At least 80% of respondents felt that technology services, career-related counseling services, and employment search assistance were "excellent" or "good". The lowest overall satisfaction ratings were received for academic advising in majors (73%).
Academic Areas Overall
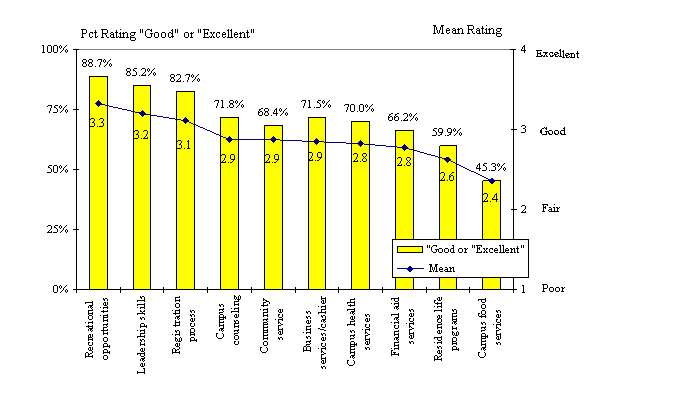
Respondents were also asked to rate their satisfaction with non-academic services such as residence hall programs, financial aid, and campus food services. These ratings were lower when compared with the academic services. At least 80% of respondents felt that recreational opportunities, leadership skills, and the registration process were "excellent" or "good". The lowest satisfaction ratings were received by campus food services (45%).
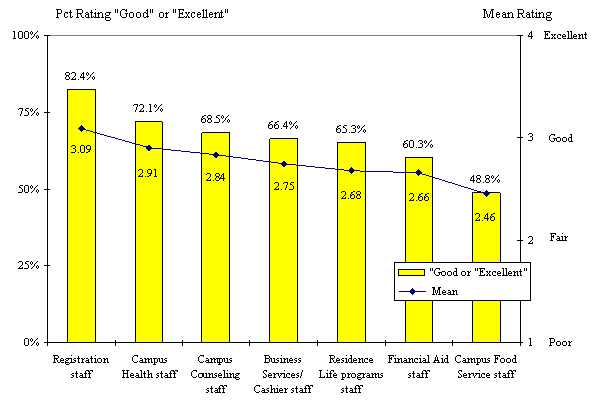
In addition to rating their satisfaction with non-academic services, respondents were also asked to rate how responsive the staffs were in seven of these areas. Over 80% of respondents felt that the registration staff was "excellent" or "good". The campus food services staff received the lowest staff responsiveness ratings.
Non-Academic Services
Non-Academic Staff Responsiveness
Detailed Services Report
Tables by Gender/Ethnicity
Tables by Academic Unit
KNOWLEDGE, SKILLS, AND PERSONAL DEVELOPMENT
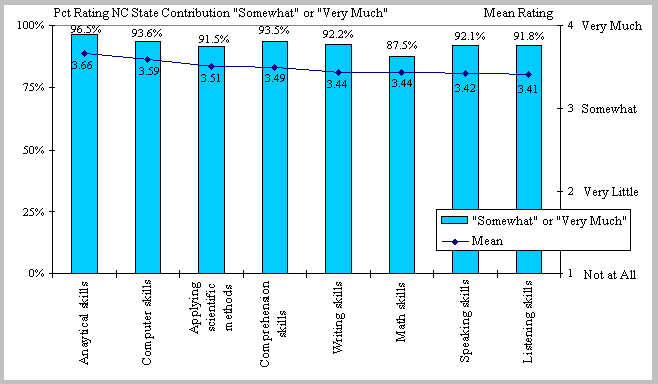
Graduating seniors were asked to rate the extent to which NC State had contributed to their knowledge, skills, and personal development in terms of four areas: technical skills, established goals for undergraduate education, personal development, and attitudes and values.
Contribution Made by NC State to Technical Skills
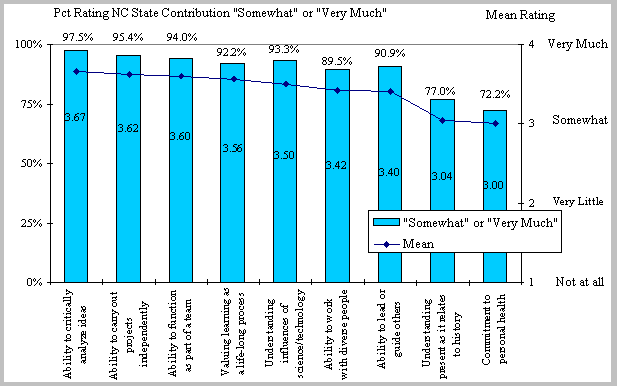
Contribution Made by NC State to Established Goals for Undergraduate Education
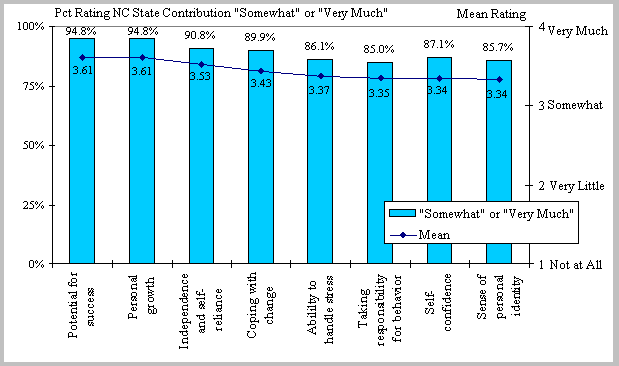
Contribution Made by NC State to Personal Development
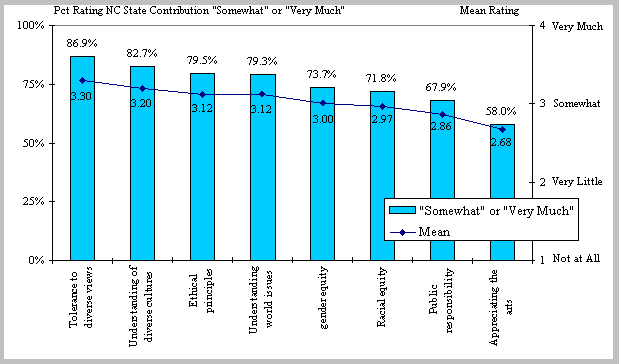
Contribution Made by NC State to Attitudes and Values
Detailed Development Report
Tables by Gender/Ethnicity
Tables by Academic Unit
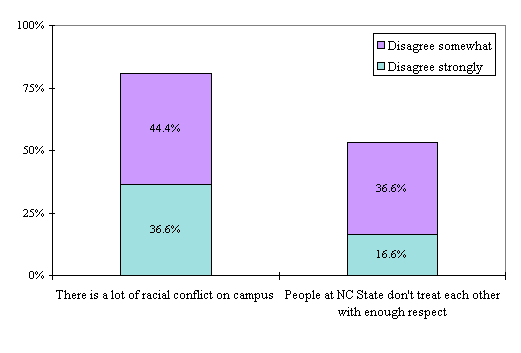
Graduating seniors were asked to assess the supportiveness or discriminatory nature of campus climate.
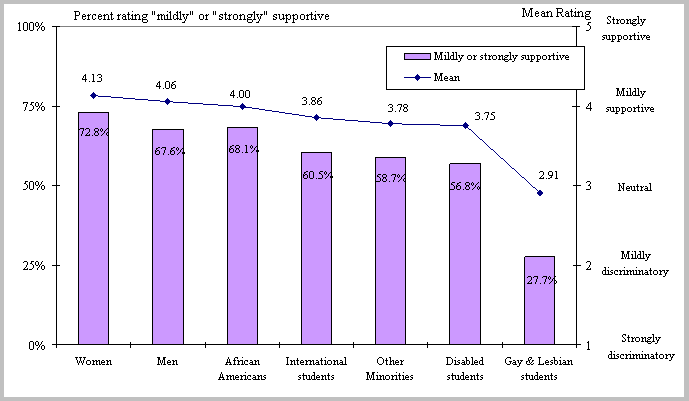
Campus Climate for Student Sub-groups
Students Disagreeing that Racial Conflict and Lack
of Respect are Prevalent
Detailed Campus Climate Report
Tables by Gender/Ethnicity
Tables by Academic Unit