Spring 1998 Graduating Senior Survey: An Overview
Table of Contents
- Introduction
- Summary
- Demographics
- Profile of Respondents
- Faculty Contributions and Academic Environment
- Services for Students
- Knowledge, Skills, and Personal Goals
Return to OIRP Survey Page
Return to OIRP Home Page
Office of Institutional Planning and Research, July 1998
Mark Lindblad, Graduate Research Assistant
Denise Gardner, Coordinator of Survey Research
This report presents descriptive statistics for NC State's 1998
Graduating Senior Survey. The purpose is to provide readers with
an overview of seniors' demographic composition, academic environment,
satisfaction with services, and educational outcomes. A more
thorough interpretation and discussion can be found in the forthcoming
sections of the Fall 1998 reports.
The sample consisted of 1,094 survey respondents, which comprised
53.9% of the population of 2,028 spring 1998 seniors who had applied
to graduate as of March 30, 1998. Tests for sample representativeness
by gender, ethnicity and college revealed no significant differences
between the sample and population.
Graduating Senior surveys were administered to those seniors
who were enrolled in the Spring 1998 semester and had applied
to graduate as of March 30, 1998. Note that this population
definition is different than in previous years. Due to UNC-General
Administration's mandates, this population may include some seniors
who did not actually graduate in May, and may exclude a few seniors
who applied to graduate after March 30th.
The demographic composition of survey respondents (n=1,094) compared
to this population (N=2,028) is shown in the following two tables.
Chi-square tests for sample representativeness revealed no significant
differences between survey respondents and the population by gender,
ethnicity, or academic unit.
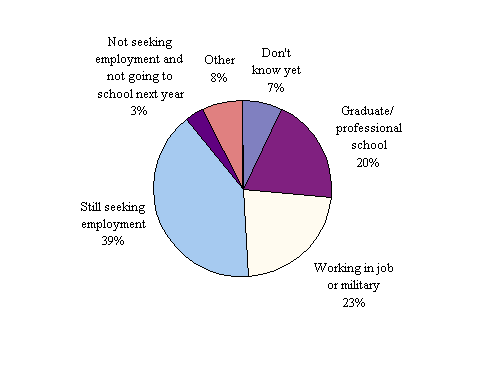
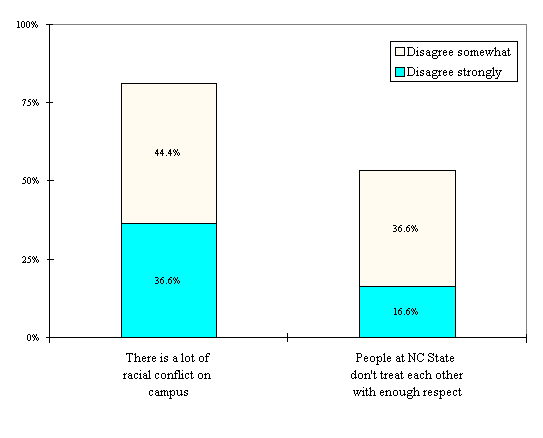
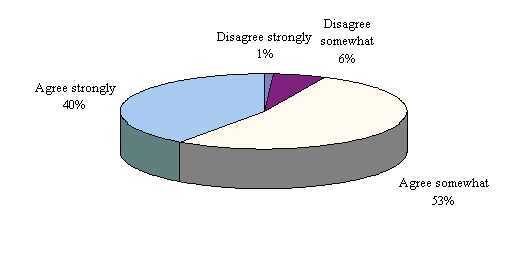
This section displays a profile of seniors in terms of employment
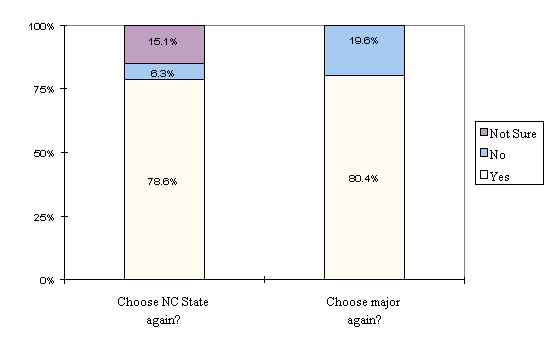
while attending NC State, field experience, campus climate, plans
after graduation, and whether or not they would choose NC State
again.
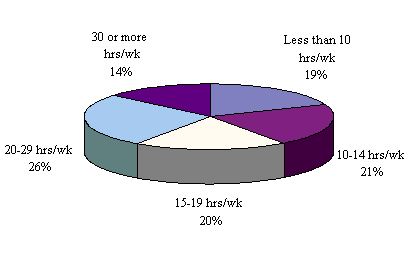
It should be noted that 83% of survey respondents indicated the
average hours that they had worked during the current academic
year.
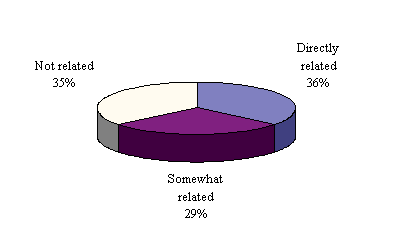
Of the 35% who said their academic year job was not related
to their major, 66% indicated that having an unrelated job was
by choice.
The 56% of respondents who indictated that their major included
a co-op, practicum, student teaching, or other field experience
were asked to evaluate that experience in terms of job offers
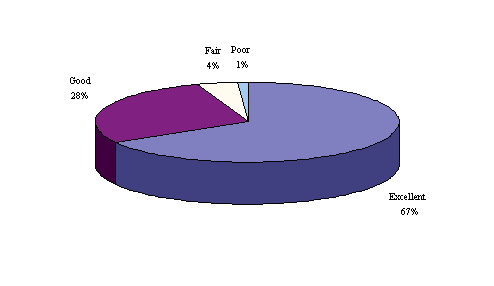
and personal and professional growth.
35% of participants received a job offer from one of their field
experience employers.
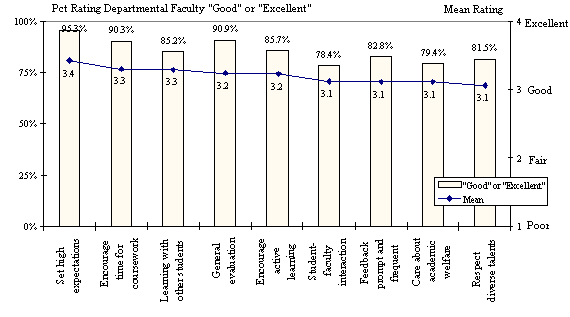
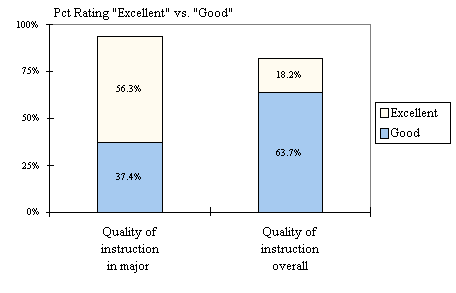
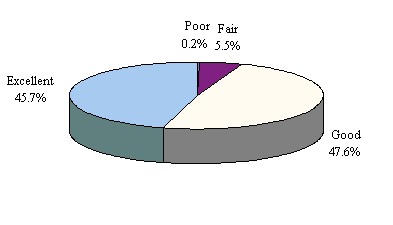
This section displays educational areas such as faculty contributions,
instruction, intellectual environment, and overall education.
Items were rated on a four-point scale ranging from 4 = "excellent"
to 1 = "poor".
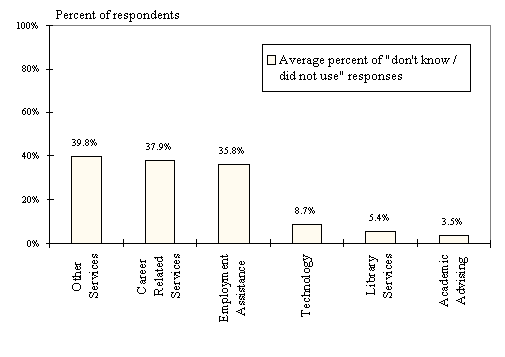
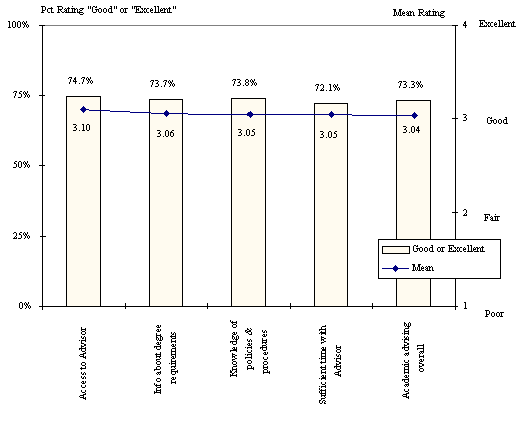
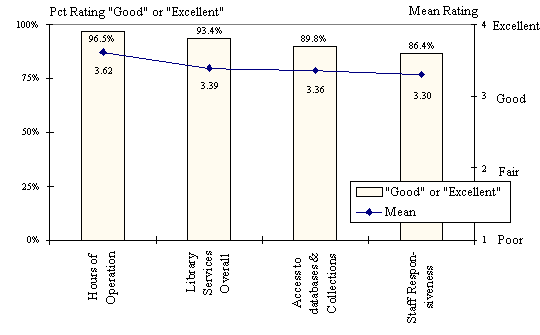
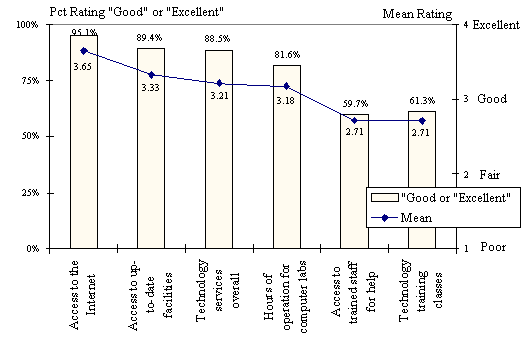
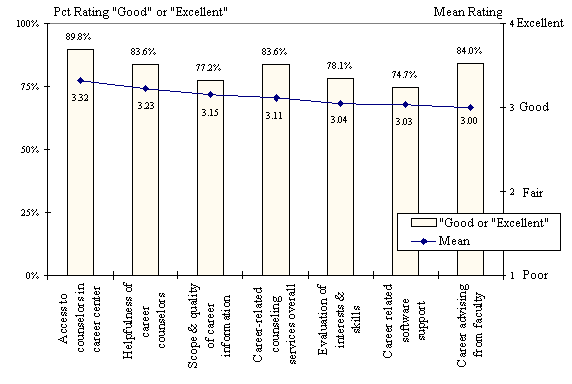
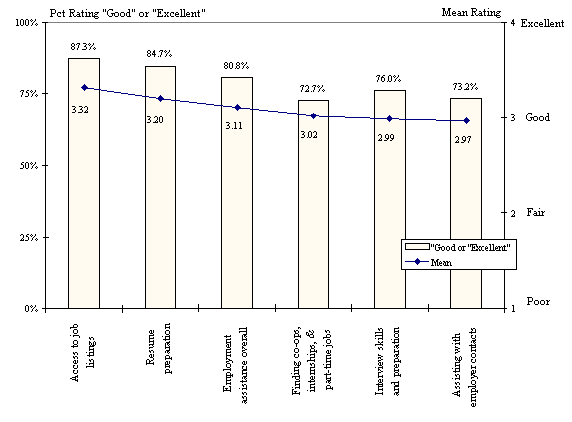
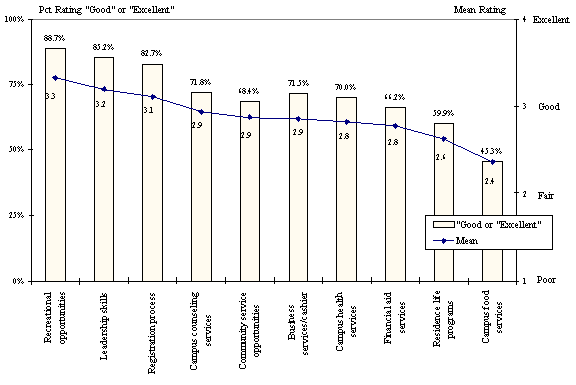
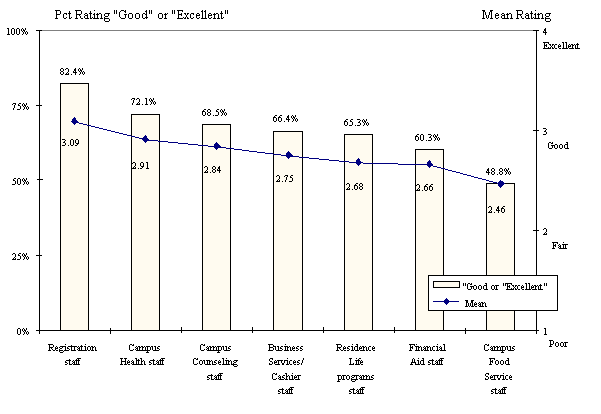
This section displays student evaluations of the services offered
by NC State. Student services included academic advising, library
services, technology services, career counseling, employment assistance,
and other service areas such as financial aid, residence life,
and recreational opportunities. Respondents were also asked to
rate staff responsiveness in seven of the service areas. Items
were rated on a four-point scale ranging from 4 = "excellent"
to 1 = "poor". A "don't know/did not use"
option allowed respondents to indicate if they were not aware
of or had not used the service. The charts in this section show
the responses in decreasing mean score order, and do not include
the "don't know" responses.
For each service area, the "don't know / did not use"
responses were summed and then divided by the number of items
in that area. This provided an average score which was converted
to a percentage and plotted on the chart below. The chart below
displays the average "don't know / did not use" responses
by student service area. Results indicate that services such
as career related services and employment assistance were used
by far fewer respondents than technology and library services.
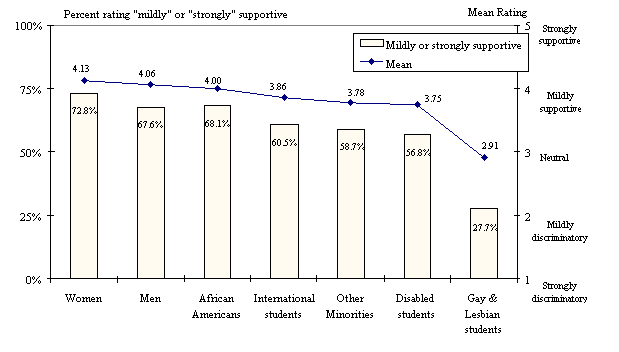
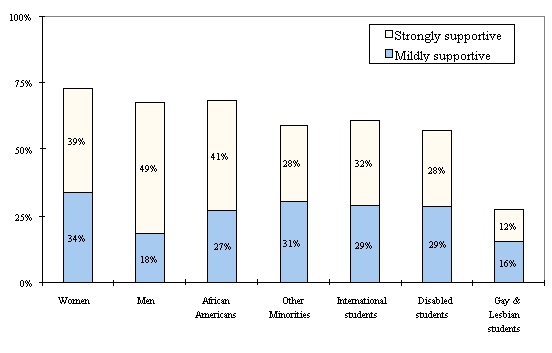
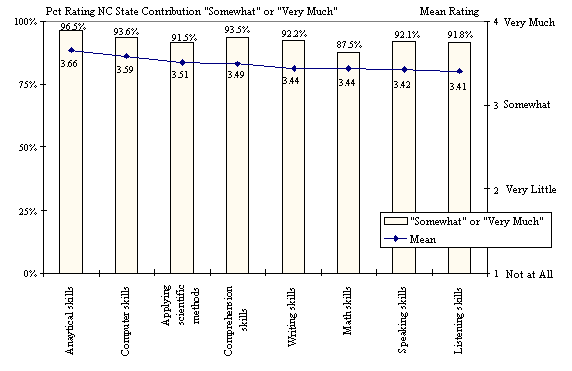
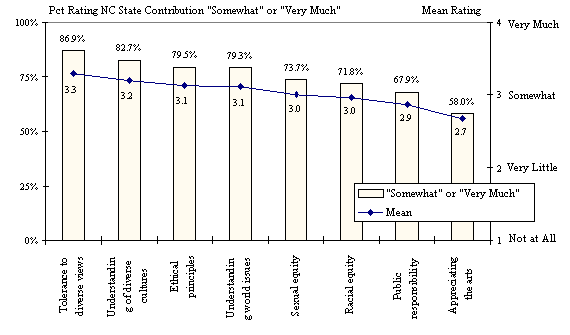
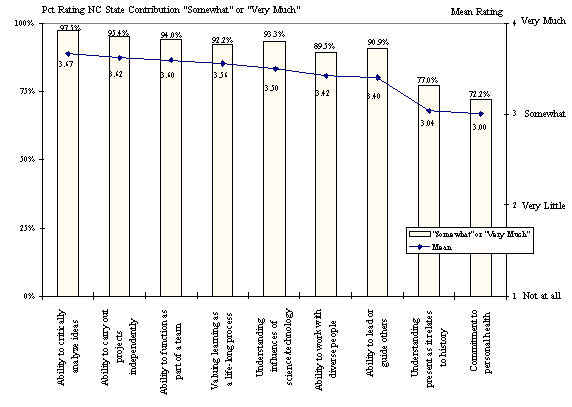
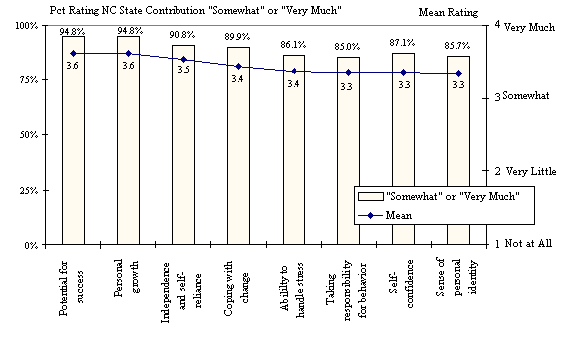
This section displays the extent to which NC State contributed
to seniors' education in terms of technical skills, attitudes
and values, established goals for undergraduate education, and
personal development. Items were rated on a four-point scale
ranging from 4 = "very much" to 1 = "not at all".
A "don't know" option was also provided. Less than
3% of respondents answered "don't know" for any of the
items in this section. The charts in this section show the responses
in decreasing mean score order, and do not include the "don't
know" responses.
African-American Other Minorities White Total:
College or School Agriculture and Life Sciences N = 378
19 % n = 191
17 % Design 68
3 % 22
2 % Education and Psychology 140
7 % 69
6 % Engineering 492
24 % 313
29% Forest Resources 87
4 % 45
4 % Humanities and Social Sciences 368
18 % 179
16 % Management 278
14 % 145
13 % Physical and Mathematical Sciences 92
5 % 53
5 % Textiles 125
6 % 77
7 % Total: N = 2,028
100 % n = 1,094
100 %