1999 Entering Transfer Student Survey:
All Respondents
![]()
1999 Entering Transfer Student Survey:
All Respondents
This overview presents findings from all transfer students responding to the 1999 New Transfer Student Survey. For information about the survey and analysis methods, see "1999 Entering Transfer Student Survey: Introduction, Methods, and Student Demographic Profile." Tables of responses by gender, race/ethnicity, and college are available on the Web.
Table of Contents:
Background Information:
Educational Intent and Interests:
Goals for Undergraduate Education:
This section presents background information provided by transfer students who responded to the survey, including whether they expect to receive financial aid, information about their households, their employment plans, and other personal information.
Transfer students indicated whether they expected to receive financial aid, including work-study, grants, loans, and scholarships. Nearly half of all respondents (47.3%) stated they expected some sort of financial aid. One-third of all respondents anticipate aid based on financial need. Table 3-1 presents the breakdowns of the types of financial aid respondents expect to receive.Table 3-1: Types of Financial Aid
|
Basis of Aid |
Students expecting |
% of Respondents |
|
Financial Need |
248 |
33.3% |
|
Academic |
90 |
12.1% |
|
Other than listed |
55 |
7.4% |
|
Athletic |
6 |
.8% |
|
Other (dance, music, etc.) |
2 |
.3% |
Student and Parent/Guardian Income (Table 3-2)
Students were given 14 income brackets ranging from under $10,000 to over $200,000 per year and asked to indicate which best described both their own and their parents' or guardians' combined 1998 pre-tax income. Over forty percent of respondents (41.7%) said their own income was $10,000 or less. In contrast, half of respondents (50.7%) said their parents' or guardians' income exceeded $60,000, and 17.6 percent said it was over $100,000.Table 3-2: Student and Parent Income
|
Pre-tax Income |
Students' Income |
Parents' Combined Income |
||
|
n |
% |
n |
% |
|
|
$10,000 or less |
126 |
41.7% |
10 |
2.1% |
|
$10,001-$15,000 |
43 |
14.2% |
12 |
2.6% |
|
$15,001-$20,000 |
32 |
10.6% |
12 |
2.6% |
|
$20,001-$25,000 |
28 |
9.3% |
14 |
3.0% |
|
$25,001-$30,000 |
18 |
6.0% |
14 |
3.0% |
|
$30,001-$35,000 |
19 |
6.3% |
28 |
6.0% |
|
$35,001-$40,000 |
13 |
4.3% |
34 |
7.3% |
|
$40,001-$50,000 |
8 |
2.6% |
56 |
12.0% |
|
$50,001-$60,000 |
2 |
0.7% |
50 |
10.7% |
|
$60,001-$75,000 |
6 |
2.0% |
68 |
14.6% |
|
$75,001-$100,000 |
4 |
1.3% |
86 |
18.5% |
|
$100,001-$150,000 |
1 |
0.3% |
49 |
10.5% |
|
$150,001-$200,000 |
1 |
0.3% |
21 |
4.5% |
|
$200,000 plus |
1 |
0.3% |
12 |
2.6% |
Parent/Guardian Education (Tables 3-3 and 3-4)
Respondents were asked to report the educational attainment of both their father/male guardian and their mother/female guardian. Almost half of respondents (44.6%) reported that their father/male guardian had a baccalaureate degree or higher. Slightly more than one-third (34.8%) reported that their mother/female guardian had at least a baccalaureate degree. Around five percent of respondents reported that mothers/female guardians and fathers/male guardians did not complete a high school degree.
Table 3-4 shows that about 30 percent of respondents reported that at least one parent/guardian had never attended college, and nearly 18 percent of respondents (17.5%) qualify as first generation students, with neither parent/guardian having attended college.
Table 3-3: Parent/Guardian Educational Attainment
|
Level of Education |
% Fathers/Male Guardians Attaining |
% Mothers/Female Guardians Attaining |
|
Less than high school |
5.4% |
4.9% |
|
High school graduate |
21.9% |
25.7% |
|
Some college/no degree |
13.7% |
16.7% |
|
Associate degree/certificate |
14.5% |
17.8% |
|
4 yr. baccalaureate degree |
26.6% |
22.1% |
|
Some graduate school |
2.5% |
3.0% |
|
Master's degree |
9.8% |
7.5% |
|
Doctorate or other prof. degree |
5.7% |
2.2% |
Table 3-4: First Generation Students
|
No College |
n |
% |
|
Father/male guardian |
197 |
27.2% |
|
Mother/female guardian |
223 |
30.6% |
|
Neither parent(s)/ guardian(s) |
129 |
17.5% |
Preparation for College (Table 3-5)
Over half of respondents said they were well prepared for college by their last institution (54.5%) and on their own (53.0%). While few respondents felt poorly prepared for college by previous schools and self-preparation, respondents were less satisfied with their high schools. About one-fifth (20.5%) said their high schools had prepared them poorly, and only one-third (32.3%) said they were well prepared for college by their high schools.
Table 3-5: Preparation for College
|
Source of Preparation |
Poorly prepared |
Adequately prepared |
Well prepared % |
|
High school |
20.5% |
47.2% |
32.3% |
|
Last institution |
5.1% |
40.4% |
54.5% |
|
Self |
3.2% |
43.8% |
53.0% |
Religious Preference (Table 3-6)
The religious preference most often reported by respondents was Baptist (26.0%), followed by Catholic (13.8%), and Methodist (11.0%). Over one-fifth of respondents (21.9%) selected the "no preference" option.
Table 3-6: Religious Preferences
|
Religious preference |
n |
% |
|
Baptist |
185 |
26.0% |
|
Catholic |
98 |
13.8% |
|
Methodist |
78 |
11.0% |
|
Other* |
70 |
9.8% |
|
Presbyterian |
45 |
6.3% |
|
Episcopal |
20 |
2.8% |
|
Lutheran |
20 |
2.8% |
|
Islamic |
13 |
1.8% |
|
Hindu |
8 |
1.1% |
|
Disciples of Christ |
5 |
0.7% |
|
Latter-Day Saints |
5 |
0.7% |
|
Unitarian |
4 |
0.6% |
|
Jewish |
3 |
0.4% |
|
Moravian |
2 |
0.3% |
|
No Preference |
156 |
21.9% |
Intended Work Community (Table 3-7)
Respondents were asked to indicate the general location in which they intend to seek employment after graduation. While 37 percent said they would work anywhere, over one-fifth (21.0%) intend to seek work exclusively in North Carolina.
Table 3-7: Intended Work Community
|
Location of future employment |
n |
% |
|
Anywhere |
270 |
37.0% |
|
In North Carolina |
153 |
21.0% |
|
Outside NC but in USA |
244 |
33.4% |
|
Outside the USA |
8 |
1.1% |
|
Will not seek employment |
55 |
7.5% |
This section of the report explores transfer students??? experience with the application process and examines those factors students considered influential in their decision to attend NC State.
Number of Institutions Previously Attended (Table 3-8)
Over two-thirds of respondents (67.1%) said they had attended only one other institution before enrolling at NC State. About one-fifth (21.7%) had attended two other institutions.
Table 3-8: Number of Institutions Previously Attended
|
Number of schools |
n |
% |
|
One |
488 |
67.1% |
|
Two |
158 |
21.7% |
|
Three |
56 |
7.7% |
|
Four |
18 |
2.5% |
|
Five or more |
7 |
1.0% |
Factors Influencing Attendance Decision (Table 3-9)
Respondents indicated the extent to which each of 19 factors influenced their decision to attend NC State. Their ratings were based on a scale from 5 = "very strong influence" to 1 = "very weak influence." Respondents who selected "not applicable" were not used in these calculations. On average, students were most likely to have said that academic reputation (mean rating = 4.0), availability of program (4.0), and location (3.9) were strong influences in their decision to attend NC State.
Respondents were also asked to indicate the single most influential factor in their decision to attend NC State. Almost one-fourth (23.7%) said "availability of program" was most influential, while an additional two-fifths of respondents cited "location" (21.3%) and "academic reputation" (20.2%).
Table 3-9: Factors Influencing Decision to Attend NC State
|
Factor |
Mean |
5: Very strong influence |
4: Strong influence |
3: Moderate influence |
2: Weak influence |
1: Very weak influence |
% rating most influential |
|
Academic reputation (n=731) |
4.0 |
30.1% |
41.3% |
24.5% |
2.5% |
1.6% |
20.2% |
|
Availability of program (n=722) |
4.0 |
42.2% |
27.1% |
23.3% |
5.1% |
2.2% |
23.7% |
|
Location (n=738) |
3.9 |
39.4% |
28.6% |
19.4% |
8.5% |
4.1% |
21.3% |
|
Level of support for my intended major (n=700) |
3.7 |
27.6% |
32.3% |
27.0% |
8.7% |
4.4% |
10.3% |
|
Facilities and resources available (n=711) |
3.6 |
21.2% |
35.0% |
30.1% |
8.7% |
4.9% |
1.8% |
|
Recommended by friend, etc. (n=617) |
3.4 |
21.6% |
24.6% |
31.3% |
13.3% |
9.2% |
3.5% |
|
Contact with a current student (n=528) |
3.2 |
19.5% |
25.8% |
26.1% |
14.6% |
14.0% |
3.8% |
|
Cost (n=697) |
3.1 |
14.8% |
21.8% |
36.7% |
14.8% |
11.9% |
5.5% |
|
Campus visit prior to orientation (n=488) |
2.9 |
11.1% |
24.2% |
28.5% |
19.9% |
16.4% |
0.8% |
|
Contact with a graduate (n=423) |
2.9 |
13.0% |
21.7% |
27.9% |
18.4% |
18.9% |
1.3% |
|
Number of hours transferred/credited (n=657) |
2.8 |
9.4% |
18.6% |
31.7% |
20.7% |
19.6% |
1.1% |
|
Extracurricular opportunities (n=491) |
2.8 |
8.4% |
19.1% |
33.6% |
17.3% |
21.6% |
1.1% |
|
Scholarships/financial aid available (n=601) |
2.7 |
9.0% |
15.0% |
32.9% |
25.0% |
18.1% |
0.3% |
|
Size (n = 680) |
2.6 |
5.9% |
14.1% |
34.7% |
27.8% |
17.5% |
1.0% |
|
Contact with a faculty/staff member (n=380) |
2.6 |
9.5% |
13.2% |
25.5% |
28.2% |
23.7% |
0.8% |
|
Publications from NC State (n=371) |
2.3 |
1.9% |
10.0% |
37.7% |
21.3% |
29.1% |
0.0% |
|
Letter from someone other than Admissions Office (n=262) |
2.2 |
3.1% |
9.5% |
26.0% |
29.0% |
32.4% |
0.0% |
|
Attendance at a college fair (n=234) |
2.1 |
2.6% |
11.5% |
20.5% |
26.9% |
38.5% |
0.0% |
|
Other* (n=51) |
4.3 |
68.6% |
7.8% |
13.7% |
2.0% |
7.8% |
3.4% |
Satisfaction with Admissions (Table 3-10)
Survey respondents were asked to rate their satisfaction with the quality of various aspects of the NC State admissions process, using a scale from 4 = "very satisfied" to 1 = "very dissatisfied." Respondents who checked "don???t know/did not use" were not included in the analyses. The majority of respondents said they were either "very" or "moderately satisfied" with university (83.4%) and departmental (89.0%) admissions. Fewer respondents were as satisfied with the financial aid process (70.1%).
Table 3-10: Satisfaction with Admissions Processes
|
Admissions processes |
Mean |
4: Very satisfied |
3: Moderately satisfied |
2: Moderately dissatisfied |
1: Very dissatisfied |
|
University admissions process |
3.2 |
36.8% |
46.6% |
12.8% |
3.8% |
|
Departmental admissions process |
3.3 |
42.6% |
46.4% |
8.1% |
2.8% |
|
Univ. Financial Aid process |
2.8 |
18.8% |
51.3% |
22.0% |
7.9% |
Transfer of Credit Hours (Table 3-11)
About three-fourths of respondents (74.4%) said the number of classes that transferred was about what NC State had led them to believe would transfer, and another 12.8 percent said it was more than they had expected. This is similar to the way students rated the credit transfer predictions made by their previous institutions.
Table 3-11: Transfer of Credit Hours
|
Transfer of credit hours |
More than I expected |
About what I |
Less than I expected |
|
According to: previous institution |
17.0% |
68.1% |
14.9% |
|
According to: NCSU |
12.8% |
74.4% |
12.8% |
Educational Intent and Interests
This section of the report focuses on the respondents??? educational intent and interests. Specifically, it explores their interest in student affairs, their enrollment status, how long they expect it will take them to complete their degree, and their plans for further education. How certain the respondents were of their major at the time of the survey and the number of hours they expect to be employed during their first semester at NC State are also reported.
Survey respondents identified the co-curricular programs and activities in which they were interested from a list of 27 such options at NC State. Greatest interest was indicated for fitness (45.7%), outdoor adventures (37.1%), intramurals (35.2%), and co-op (cooperative education) program (33.5%).
Table 3-12: NC State Co-curricular Programs/Activities
|
Program/Activity |
n Expressing interest |
% Expressing interest |
|
Fitness (aerobics, walking, etc.) |
340 |
45.7% |
|
Outdoor adventures |
276 |
37.1% |
|
Intramurals |
262 |
35.2% |
|
Co-op program |
249 |
33.5% |
|
Volunteer services |
177 |
23.8% |
|
Theatre participation as audience |
170 |
22.8% |
|
Study abroad/student exchange |
165 |
22.2% |
|
Club sports |
164 |
22.0% |
|
Attending art exhibitions |
133 |
17.9% |
|
Social fraternity/sorority |
122 |
16.4% |
|
Healthy lifestyles issues |
121 |
16.3% |
|
Indoor recreation |
105 |
14.1% |
|
Student government |
97 |
13.0% |
|
Selecting performing arts attractions |
97 |
13.0% |
|
Student publications/media |
82 |
11.0% |
|
Student leadership development program |
82 |
11.0% |
|
The Crafts Center programs/classes |
81 |
10.9% |
|
Informal recreation |
78 |
10.5% |
|
Gender issues |
63 |
8.5% |
|
Music minor, bands, choirs, etc. |
61 |
8.2% |
|
Planning programs and services for children |
61 |
8.2% |
|
Union activities board programs/activities |
56 |
7.5% |
|
Theatre participation as artist |
56 |
7.5% |
|
Student Dance Companies |
54 |
7.3% |
|
Student judicial board |
32 |
4.3% |
|
Residence hall councils |
27 |
3.6% |
|
ROTC |
26 |
3.5% |
First Semester Enrollment Status (Tables 3-13 and 3-14)
Respondents were asked to report the number of credit hours for which they were enrolled during their first semester at NC State. A slight majority (55.7%) said they would be taking 15 credit hours or more.
Of those reporting less than a 15 credit hour enrollment status (n = 304), the most frequently reported reasons were "need to work" (57.9%) and "want to make better grades" (49.3%).
Table 3-13: Enrollment Status
|
Enrollment status |
n |
% |
|
15 credit hours of classes or more |
383 |
55.7% |
|
12-14 credit hours of classes |
250 |
36.4% |
|
Less than 12 credit hours of classes |
54 |
7.9% |
Table 3-14: Reasons for Less than 15 Credit Hour Enrollment Status
|
Reason |
n |
% |
|
Yes: reported |
||
|
Need to work |
176 |
57.9% |
|
Want to make better grades |
150 |
49.3% |
|
Courses wanted unavailable |
69 |
22.7% |
|
Family responsibilities |
44 |
14.5% |
|
Advisor suggested lighter load |
45 |
14.8% |
|
Too much with another big course |
41 |
13.5% |
|
Other reason* |
32 |
10.5% |
|
Did not need more courses |
12 |
4.0% |
|
Was doing internship, co-op, etc. |
4 |
1.3% |
Amount of Time to Complete Degree (Table 3-15)
The majority of entering transfer students (88.3%) expect to earn their baccalaureate degree in three years or less after arriving at NC State.
Table 3-15: Amount of Time to Complete Degree
|
Intended time |
n |
% |
|
1 year |
10 |
1.3% |
|
2 years |
344 |
46.4% |
|
3 years |
301 |
40.6% |
|
4 years |
69 |
9.3% |
|
More than 4 years |
14 |
1.9% |
|
Will not complete Bachelor's |
3 |
0.4% |
Highest Level of Education (Table 3-16)
Nearly half of respondents (45.5%) plan to attain a master???s degree as their highest level of education. Almost three-fourths of respondents (71.3%) plan to pursue education beyond a baccalaureate degree.
Table 3-16: Highest Level of Education Intended
|
Level of education planned |
n |
% |
|
Bachelor's degree |
212 |
28.7% |
|
Master's degree |
336 |
45.5% |
|
Doctoral degree |
96 |
13.0% |
|
Doctor of Veterinary Medicine |
39 |
5.3% |
|
Other professional degree |
55 |
7.5% |
Goals and Objectives at NC State (Tables 3-17 and 3-18)
In keeping with the high frequency of respondents anticipating a graduate education, the most frequently reported primary goal in attending NC State was "to obtain a bachelor???s degree as preparation for graduate or professional school" (47.2%). The next most common objective was "to obtain a bachelor???s degree as preparation for a new career or profession" (40.4%). A large majority of respondents said they were "very certain" or "certain" in their choice of college major (84.3%).
Table 3-17: Goals and Objectives at NC State
|
Goal in attending NC State |
n |
% |
|
Obtain a bachelor's degree/cert. only |
69 |
9.3% |
|
BA for graduate school preparation |
349 |
47.2% |
|
BA for career preparation |
299 |
40.4% |
|
Improve skills for current profession |
7 |
0.9% |
|
Take courses for personal interest |
1 |
0.1% |
|
Other |
15 |
2.0% |
Table 3-18: Certainty of College Major
|
Certainty of college major |
n |
% |
|
Very certain |
349 |
47.0% |
|
Certain |
277 |
37.3% |
|
Uncertain |
102 |
13.7% |
|
Very uncertain |
15 |
2.0% |
First Semester Employment Plans (Table 3-19)
Respondents were asked to report the number of hours they intended to work during their first semester at NC State. Less than one-third (28.7%) do not plan on being employed, while 31.7 percent plan on working 20 hours or more each week.
Table 3-19: First Semester Employment Plans
|
Semester employment |
n |
% |
|
Less than 20 hrs/wk |
289 |
39.5% |
|
20 or more hrs/wk |
232 |
31.7% |
|
Do not plan to work |
210 |
28.7% |
Goals for Undergraduate Education
This section presents information about respondents??? educational goals. The 35 goals asked about related to personal development, general education, and world views. Tables 3-20 and 3-21 present respondents??? mean ratings of each goal.
Respondents were asked to rate their current level of development on each goal and how important the goal is to them right now. Current level of development was rated on a scale from 5 = "very high" to 1 = "very low." Goal importance was rated on a scale from 5 = "very important" to 1 = "not important." "Don???t know" responses in both current development and importance ratings were excluded from the analysis.
Overall, personal development goals tended to receive higher mean ratings on current development than did the other areas, with 7 of the 10 highest mean ratings. Two of the world view goals, however, had the third and fourth highest mean ratings for current development. The four highest mean ratings were for taking responsibility for my own behavior (4.44), viewing learning as a lifelong process (4.25), valuing racial equity (4.16), and valuing gender equity (4.10).
Ratings of goal importance were consistently higher than ratings of current development. Again, personal development goals were given higher ratings than those related to general education and world views (9 of 10 highest mean ratings for importance). The four highest average importance ratings were for taking responsibility for my own behavior (4.61), having self-discipline (4.60), having self-confidence (4.59), and managing my time (4.58).
Table 3-20: Current Development
|
Mean Development* |
|
|
Plan/carry out projects independently |
3.84 |
|
Good listening skills |
3.80 |
|
Broad general education |
3.71 |
|
Good reading comprehension skills |
3.69 |
|
Critically analyze information |
3.66 |
|
Understand scientific influence |
3.61 |
|
Communicate in writing |
3.59 |
|
Understand diverse cultures |
3.54 |
|
Apply mathematics skills |
3.53 |
|
Communicate ideas orally |
3.50 |
|
Develop computer skills |
3.42 |
|
Apply scientific principles |
3.31 |
|
Mean Development* |
|
|
Taking responsibility for behavior |
4.44 |
|
Viewing learning as lifelong |
4.25 |
|
Being independent and self-reliant |
4.06 |
|
Acting upon ethical principles |
4.05 |
|
Function as part of a team |
3.95 |
|
Understanding own abilities and interests |
3.93 |
|
Clarifying personal identity |
3.78 |
|
Having self-discipline |
3.78 |
|
Realizing my potential for success |
3.77 |
|
Having self-confidence |
3.72 |
|
Coping with change |
3.72 |
|
Improving leadership/management skills |
3.63 |
|
Commitment to health and fitness |
3.56 |
|
Handling stress |
3.52 |
|
Managing my time |
3.46 |
|
Involved with public/community affairs |
3.14 |
|
Mean Development* |
|
|
Valuing racial equity |
4.16 |
|
Valuing gender equity |
4.10 |
|
Interact with diverse people |
3.86 |
|
Tolerance for different views |
3.84 |
|
World problems/issues |
3.44 |
|
Appreciation of the arts |
3.41 |
|
Present as it relates to history |
3.37 |
|
Mean Importance* |
|
|
Develop computer skills |
4.47 |
|
Plan/carry out project independently |
4.39 |
|
Communicate ideas orally |
4.37 |
|
Good listening skills |
4.37 |
|
Good reading comprehension skills |
4.27 |
|
Critically analyze information |
4.23 |
|
Broad general education |
4.21 |
|
Apply mathematics skills |
4.21 |
|
Communicate in writing |
4.16 |
|
Understand scientific influence |
4.11 |
|
Apply scientific principles |
3.96 |
|
Understand diverse cultures |
3.96 |
|
Mean Importance* |
|
|
Taking responsibility for behavior |
4.61 |
|
Having self-discipline |
4.60 |
|
Having self-confidence |
4.59 |
|
Managing my time |
4.58 |
|
Realizing my potential for success |
4.52 |
|
Handling stress |
4.52 |
|
Being independent and self-reliant |
4.49 |
|
Understanding own abilities and interests |
4.46 |
|
Viewing learning as lifelong |
4.43 |
|
Function as part of a team |
4.42 |
|
Improving leadership/management skills |
4.41 |
|
Commitment to health and fitness |
4.38 |
|
Acting upon ethical principles |
4.32 |
|
Coping with change |
4.29 |
|
Clarifying personal identity |
4.26 |
|
Involved with public/community affairs |
3.86 |
|
Mean Importance* |
|
|
Tolerance for different views |
4.34 |
|
Valuing racial equity |
4.33 |
|
Interact with diverse people |
4.29 |
|
Valuing gender equity |
4.27 |
|
World problems/issues |
4.10 |
|
Present as it relates to history |
3.88 |
|
Appreciation of the arts |
3.85 |
Comparing Average Ratings for Current Development and Importance of Goals (Chart 3-1)
Considerable variation exists in mean ratings of importance and development for each goal rated by survey respondents. These differences reveal potentially important aspects of students' goal orientation. Chart 3-1 graphically displays the inconsistencies in mean ratings of importance and development. The data points cluster on the lower right side of the chart, reflecting the fact that importance was consistently rated higher than current development.
The upper right quadrant contains goals that are rated relatively high in both importance and development. Thus, goals falling in this quadrant are those that respondents feel are particularly important and on which they feel they have made a good start. Especially noteworthy is number 13, taking responsibility for my own behavior.
Goals in the lower right quadrant were rated high in importance but comparatively lower in development. These are goals that are important for students, but which they feel have not been developed to the same extent as other goals. Most prominent is number 27, managing my time. Other goals in this quadrant include developing computer skills (9) and handling stress (26). In general, these items represent areas which students value and wish to improve upon.
Goals in the lower left quadrant were rated lower in both importance and development than many of the other goals. In general, the respondents are less concerned about these areas. Involved with public and community affairs (18) has a noticeably lower average development rating than the other goals.
Chart 3-1: Scatterplot of Goal Development and Importance Ratings
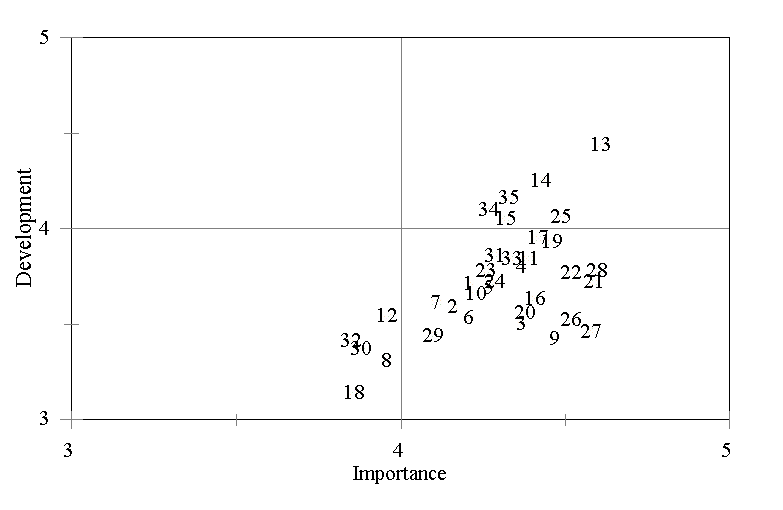
|
1 Acquiring a broad general education |
19 Understanding own abilities/interests |
|
2 Ability to communicate ideas in writing |
20 Commitment to health and fitness |
|
3 Ability to communicate ideas orally |
21 Having self-confidence |
|
4 Developing good listening skills |
22 Realizing my potential for success |
|
5 Developing reading comp. skills |
23 Clarifying personal identity |
|
6 Ability to apply math skills |
24 Coping with change |
|
7 Understanding scientific influence |
25 Being independent and self-reliant |
|
8 Apply scientific principles |
26 Handling stress |
|
9 Developing computer skills |
27 Managing my time |
|
10 Critically analyze info. |
28 Having self-discipline |
|
11 Plan/carry out project independently |
29 World problems/issues |
|
12 Understanding diverse cultures |
30 Present as it relates to history |
|
13 Taking responsibility for behavior |
31 Interact with diverse people |
|
14 Learning as lifelong process |
32 Appreciation of the arts |
|
15 Acting on ethical principles |
33 Tolerance for different views |
|
16 Leadership/management skills |
34 Valuing gender equity |
|
17 Function as part of a team |
35 Valuing racial equity |
|
18 Involved with public and comm. affairs |
Goal development and importance by rank order: Gender/Ethnicity
Comparisons: Gender/Ethnicity
Back to Top
For more information on the 1999 Entering Transfer Student Survey
contact:
Dr. Nancy Whelchel, Associate Director for Survey Research
Office of Institutional Planning and Research
Box 7002
NCSU
Phone: (919) 515-4184
E-mail: Nancy_Whelchel@ncsu.edu
Posted:
Download a Microsoft Word Version (Word 6.0 or higher)
of this report.
We've named the file .bin so your browser gives you a
download window instead of displaying the file.
When you download it you can rename it to .doc to indicate
that it's a Word file.
Return to 1999 Entering Transfer Student Survey Table of Contents Page