1998 First Year Student Survey:
All Respondents
![]()
1998 First Year Student Survey:
All Respondents
This overview presents findings from all first year students participating in the 1998 First Year Student Survey. Subsequent reports provide more detailed analyses of responses by gender, race/ethnicity, and college. For information about the survey and analysis methods, see "1998 First Year Student Survey: Introduction, Methods, and Student Demographic Profile."
Table of Contents:
Background Information:
Educational Intent and Interests:
Goals for Undergraduate Education:
Background Information
This section presents background information provided by first-year students who responded to the survey, including whether they expect to receive financial aid, information about their households, their employment plans, and other personal information.
First-year students indicated whether they expected to receive financial aid, including work-study, grants, loans, and scholarships. The majority (57.8%) stated they expected some sort of financial aid. Almost one-third of all survey respondents expected to receive some aid based on financial need. Table 3-1 presents the breakdowns of the types of financial aid respondents expect to receive.
Table 3-1: Types of Financial Aid
|
Basis of Aid |
n |
% |
|
Financial need |
1,037 |
32.0 |
|
Academic |
963 |
29.7 |
|
Athletic |
68 |
2.1 |
|
Other (dance, music, etc.) |
38 |
1.2 |
|
Other than listed |
364 |
11.2 |
Parent/Guardian Income (Table 3-2)
Students were given 14 income brackets ranging from under $10,000 to over $200,001 per year, and asked to indicate which best described their parents' or guardians' combined pre-tax income. Two-thirds (65.8%) of the respondents reported income brackets over $50,000, with 20.0 percent stating that their combined family income was over $100,000.
|
Income Bracket |
n |
% |
|
$10,000 or less |
50 |
1.8 |
|
$10,001 - 15,000 |
51 |
1.8 |
|
$15,001 - 20,000 |
65 |
2.3 |
|
$20,001 - 25,000 |
90 |
3.2 |
|
$25,001 - 30,000 |
106 |
3.8 |
|
$30,001 - 35,000 |
121 |
4.4 |
|
$35,001 - 40,000 |
186 |
6.7 |
|
$40,001 - 50,000 |
253 |
9.1 |
|
$50,001 - 60,000 |
349 |
12.6 |
|
$60,001 - 75,000 |
452 |
16.3 |
|
$75,001 - 100,000 |
497 |
17.9 |
|
$100,001 - 150,000 |
362 |
13.0 |
|
$150,001 - 200,000 |
98 |
3.5 |
|
$200,001 plus |
98 |
3.5 |
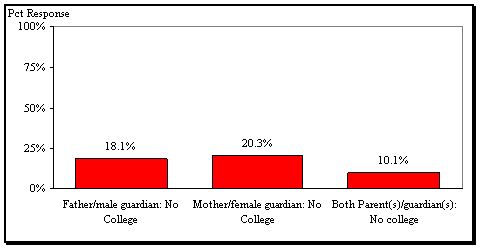
Parent/Guardian Education (Charts 3-1 and 3-2)
Students were asked to report the educational attainment of their mother/female guardian and father/male guardian. A majority of respondents (59.3%) reported that the educational attainment of fathers/male guardians was a four-year baccalaureate degree or higher. About half of the respondents (51.9%) reported that their mother/female guardian had at least a four-year baccalaureate degree. About 10 percent (10.1%) of survey respondents said that neither parent/guardian had attended college.

Household Information (Charts 3-3 and 3-4)
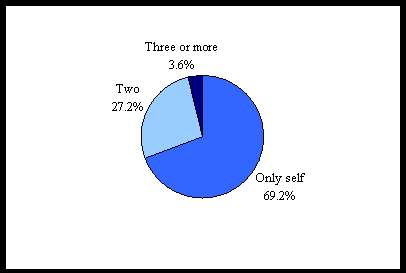
The majority (84.3%) of respondents indicated they came from a household with three or more dependents, including themselves. More than two-thirds of the respondents (69.2%), however, indicated that they were the only dependent of the household currently enrolled in college.
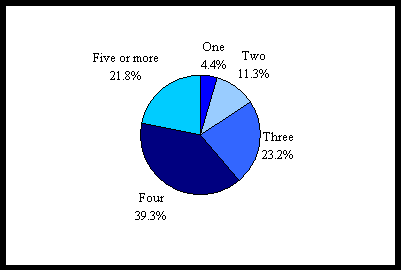
Chart 3-4: Household Dependents in College
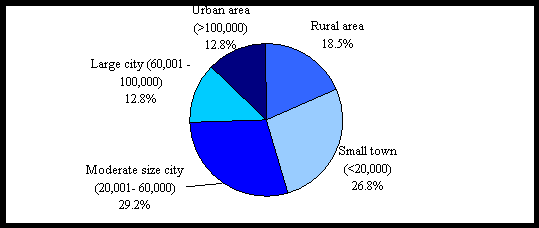
Home Community (Chart 3-5)
First-year survey respondents were asked to describe the population size of their home community. About 29 percent of all respondents indicated they come from a 'moderately sized city.' More than one-quarter (26.8%) described their home residence as a 'small town.'
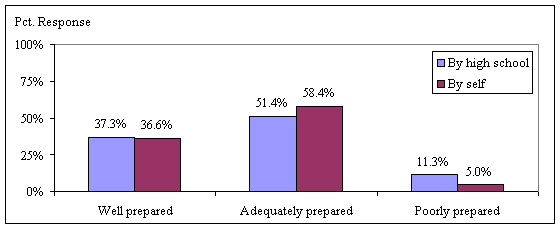
Preparation for College (Chart 3-6)
More than one-third of respondents reported that they had been "well prepared" for college by their high school (37.3%) and on their own (36.6%). However, 11.3 percent of first-year survey respondents rated the college preparation they received from their high school as poor. Less than half that many (5%) rate their own personal preparation for college as poor.
Religion (Table 3-3)
The religious preference most often reported by respondents was Baptist (28.4%), followed by Methodist (15.2%) and Catholic (11.3%). About 15 percent of the respondents selected the "no preference" option.
|
Religious Preferences |
n |
% |
|
Baptist |
890 |
28.4 |
|
No preference |
485 |
15.5 |
|
Methodist |
476 |
15.2 |
|
Catholic |
355 |
11.3 |
|
Other |
278 |
8.9 |
|
Presbyterian |
263 |
8.4 |
|
Lutheran |
134 |
4.3 |
|
Episcopal |
115 |
3.7 |
|
Disciples of Christ |
30 |
1.0 |
|
Hindu |
26 |
0.8 |
|
Jewish |
26 |
0.8 |
|
Latter-Day Saints |
18 |
0.6 |
|
Moravian |
16 |
0.5 |
|
Islamic |
14 |
0.4 |
|
Unitarian |
7 |
0.2 |
Survey respondents were given a list of disabilities and asked to indicate any they may have. While relatively few students indicated any disability, the most frequently named was a learning disability/ADD.
|
Disability |
n |
% |
|
Learning Disability/ADD |
92 |
2.8 |
|
Other |
51 |
1.6 |
|
Psychological |
15 |
0.5 |
|
Hard of hearing/Deaf |
15 |
0.5 |
|
Legally Blind |
12 |
0.4 |
|
Traumatic Head Injury |
5 |
0.2 |
|
Mobility Impairment |
4 |
0.1 |
|
None Indicated |
3046 |
94.0 |
Musical Instruments Played (Table 3-5)
Survey respondents were given a list of various musical instruments (grouped in small categories), and asked to indicate which, if any, they play. The most common of these instruments played by first-year students were Clarinet/Saxophone, followed by French horn/Trumpet/Cornet.
|
Instrument |
n |
% |
|
Clarinet/Saxophone |
263 |
8.1 |
|
French Horn/Trumpet/Cornet |
171 |
5.3 |
|
Flute/Piccolo |
126 |
3.9 |
|
Tympani/Mallet/Percussion |
118 |
3.6 |
|
Trombone/Baritone /Euphonium/Tuba |
115 |
3.5 |
|
Violin/Viola |
76 |
2.3 |
|
Cello/Double Bass |
30 |
0.9 |
|
Oboe/Bassoon |
24 |
0.7 |
|
Bagpipes |
10 |
0.3 |
|
None of those listed |
2307 |
71.2 |
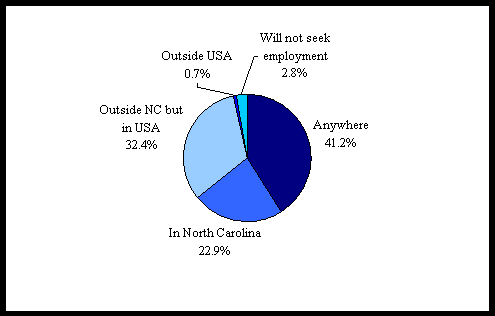
Intended Work Community (Chart 3-7)
Survey respondents were asked to indicate the general location in which they intend to seek employment after graduation. Almost one-fourth (22.9%) said they intend to look for work only in North Carolina.
This section of the report explores new students' experiences with the application process, and examines those factors students considered influential in their decision to attend NC State.
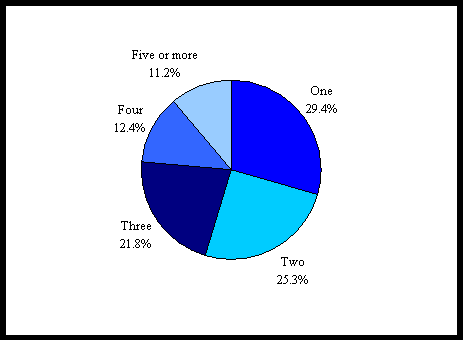
Number of Schools to Which Students Applied (Chart 3-8)
When asked to indicate the number of schools to which they had applied, 29.4 percent of respondents said they only applied to NC State. Another 25 percent applied to only one other school.
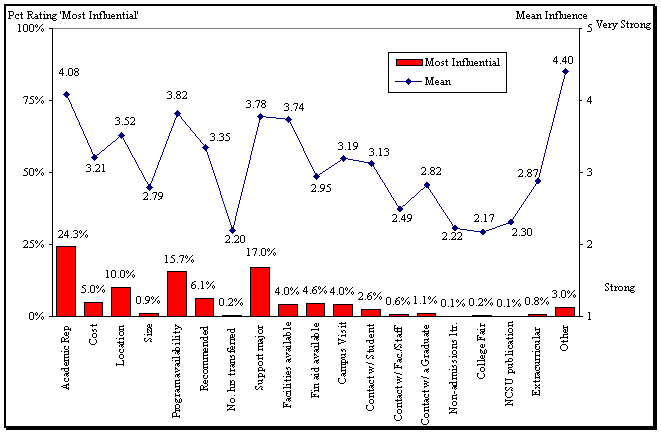
Factors Influencing Decision to Attend (Charts 3-9 and 3-10)
Respondents indicated the extent to which each of 19 factors influenced their decision to attend NC State. The rating scale went from 5 = 'very strong influence' to 1 = 'very weak influence.' On average, respondents were most likely to report that the academic reputation of NC State, the availability of program, the level of support for my intended major, and facilities and resources available were strong influences in their decision to attend NC State.
Respondents were also asked to indicate the single most influential factor in their decision to attend NC State. Almost one-fourth said academic reputation was most influential (24.3%), followed by level of support for my intended major (17.0%) and availability of program (15.7%).
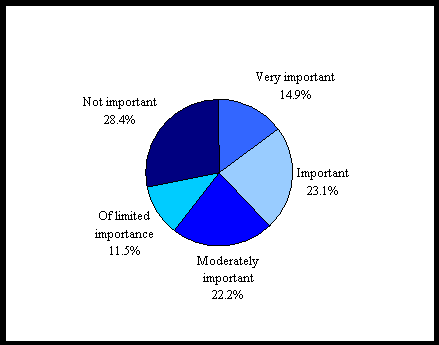
Students who were accepted in the First Year College (FYC) program were asked to rate its importance in their decision to attend NC State. 38.0 percent of FYC respondents indicated that acceptance into the program was either 'very important' or 'important.'
Satisfaction with Admissions (Chart 3-11)
Survey respondents were asked to rate their satisfaction with the quality of various aspects of the NC State admissions process on a scale from 4 = 'very satisfied' to 1 = 'very dissatisfied'. (The few respondents who checked "don't know/did not use" were not included in the calculations). Almost all respondents said they were either "very" or "moderately satisfied" with university and departmental admissions (93.1% and 92.1% respectively). More than two-thirds reported being "very" or "moderately satisfied" with the financial aid process (67.7%).

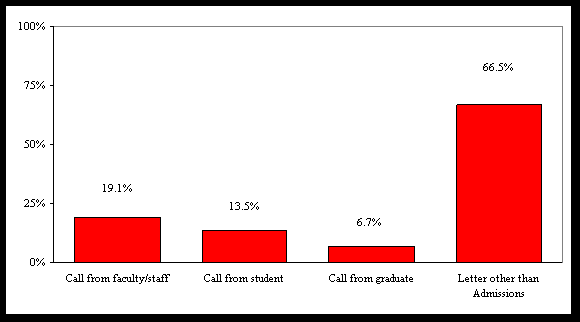
NC State Contacts During the Admissions Process (Chart 3-12)
Two-thirds of the respondents reported receiving a letter from someone connected to the University other than the Admissions Office after applying for admission to NC State. Almost 20 percent of respondents (19.1%) reported receiving a call from an NC State faculty or staff member. Fewer respondents got calls from either current NC State students or from an alumnus.
Educational Intent and Interests
This section of the report focuses on respondents' educational intent and interests. Specifically, it explores their interest in various student programs and activities, their enrollment status, how long they expected it would take them to complete their degree, and plans for further education. How certain the respondents were of the academic major they would pursue, and the number of hours they expected to be employed while in school, are also reported.
Student Affairs (Table 3-6)
Survey respondents identified the co-curricular programs and activities in which they were interested, from a list of 27 such options at NC State. Greatest interest was indicated for intramurals (basketball, golf, table 3-tennis, etc.), fitness (aerobics, walking, etc.), outdoor adventures (backpacking, camping, rock-climbing, etc.), and the Co-op (Cooperative Education) program.
|
Program/Activity |
n |
% |
|
Intramurals |
1667 |
51.5 |
|
Fitness |
1414 |
43.6 |
|
Outdoor adventures |
1338 |
41.3 |
|
Co-op program |
1251 |
38.6 |
|
Volunteer services |
1067 |
32.9 |
|
Social fraternity/sorority |
1006 |
31.0 |
|
Club sports |
999 |
30.8 |
|
Study abroad/student exchange |
922 |
28.5 |
|
Student government |
789 |
24.4 |
|
Theater as audience |
783 |
24.2 |
|
Indoor recreation |
677 |
20.9 |
|
Informal recreation |
516 |
15.9 |
|
Student leadership program |
498 |
15.4 |
|
Performing arts |
493 |
15.2 |
|
Attend art exhibits |
479 |
14.8 |
|
Musical interests |
447 |
13.8 |
|
Healthy-life issues |
436 |
13.5 |
|
Student publications/media |
413 |
12.7 |
|
Residence hall council |
399 |
12.3 |
|
Theater as artist |
348 |
10.7 |
|
Planning programs/services |
246 |
7.6 |
|
UAB programs/activities |
239 |
7.4 |
|
Student dance co. |
229 |
7.1 |
|
Crafts Center programs/classes |
193 |
6.0 |
|
Student J-board |
182 |
5.6 |
|
ROTC |
136 |
4.2 |
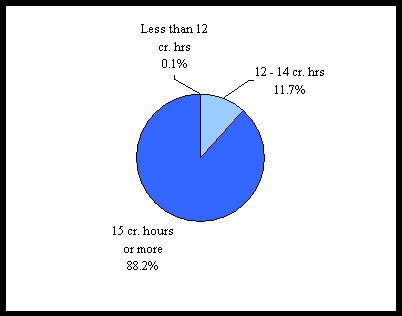
First Semester Enrollment (Chart 3-13; Table 3-7)
Respondents were asked to report the number of credit hours for which they were enrolled. The vast majority (88.2%) reported planning at least 15 credit hours their first semester.
Of those students reporting less than a 15 credit hour enrollment status in the first semester (n=346), the most common reasons reported were that 'courses were unavailable' (35.3%) and the respondent 'wants better grades' (42.2%).
|
Reason |
n |
% |
|
Courses unavailable |
122 |
35.3 |
|
Want better grades |
146 |
42.2 |
|
Combination of courses |
85 |
24.6 |
|
Advice of advisor |
72 |
20.8 |
|
Other* |
55 |
15.9 |
|
Need to work |
50 |
14.4 |
|
Did not need more courses |
10 |
2.9 |
|
Family responsibilities |
13 |
3.8 |
|
Other obligations |
0 |
0 |
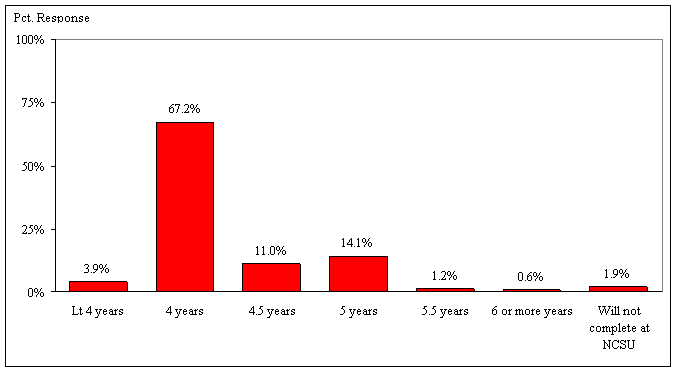
Amount of Time to Complete Degree (Chart 3-14)
Respondents were asked to estimate the amount of time they intended to take to earn their bachelor's degree at NC State. While more than two-thirds (67.2%) say they expect to graduate from NC State in four years, another 25 percent say it will take up to five years to finish.
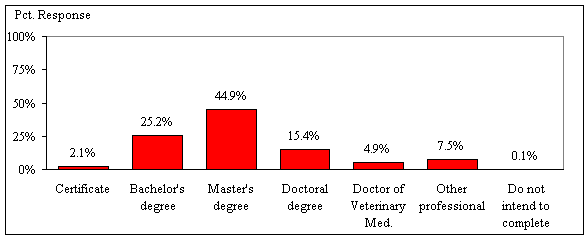
Highest Level of Education (Chart 3-15)
A large majority of respondents (72.8%) indicated they would like to continue their education beyond a Bachelor's degree.
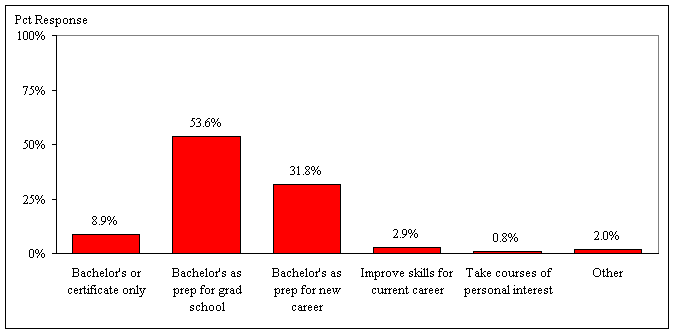
Goals and Objectives at NC State (Charts 3-16 and 3-17)
Slightly more than half (53.6%) of respondents stated that their primary goal for attending NC State was to obtain a bachelor's degree as "preparation for graduate or professional school." Only 5.7 percent of respondents do not intend to get a bachelor's degree.
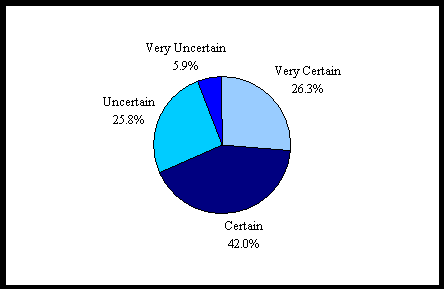
More than two-thirds (68.3%) of respondents indicated that they were either 'certain' or 'very certain' of their choice in college major.
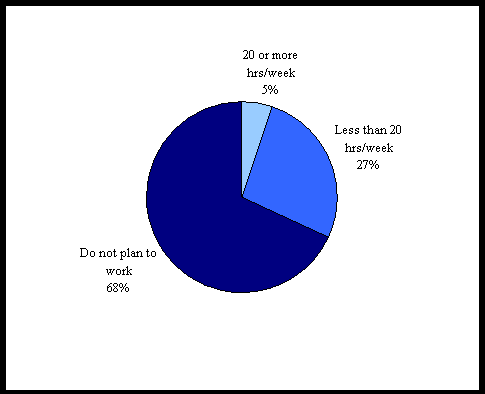
Semester Employment Plans (Chart 3-18)
Respondents were asked to report the number of hours they intended to work during their first semester at NC State. Few (5.2%) respondents plan to work 20 hours or more each week, whereas just over two-thirds (68.1%) do not plan to work at all their first semester (see Chart 3-18).
Goals for Undergraduate Education
This section presents information about respondents' educational goals. The 35 goals asked about related to either personal development, general education, or world views (see Charts 3-19, 3-20, and 3-21).
Respondents were asked to rate their current level of development on each goal and how important the goal is to them right now. Current level of development was rated on a scale from 1 = 'very low' to 5 = 'very high.' Goal importance was rated on a scale from 1 = 'not important' to 5 = 'very important'. "Don't know" responses in both lists were excluded from the analysis.
Overall, personal development goals tended to receive higher mean ratings on current level of development than did the other areas, with 7 of the 10 highest mean ratings. Current level of development of two of the world view goals, however, had the second and third highest mean ratings. The four highest mean ratings were for taking responsibility for my own behavior (4.3), valuing racial equity (4.1), valuing gender equity (4.1), and viewing learning as a lifelong process (4.1).
Ratings of goal importance were consistently higher than ratings of current level of development. Personal development goals were consistently given higher ratings than those related to general education and world views. The three highest averages were for managing my time (4.6), having self-confidence (4.6), and taking responsibility for my own behavior (4.6).
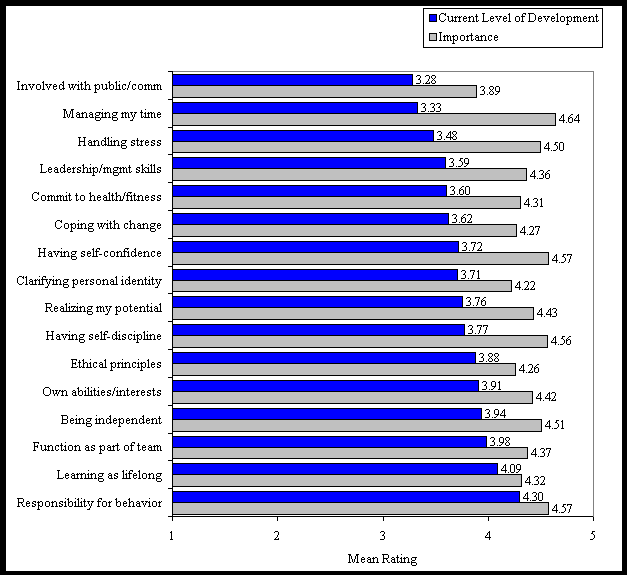
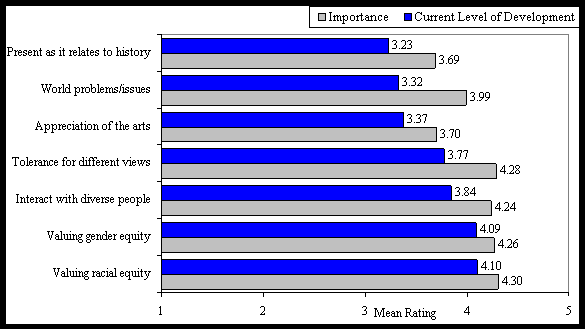
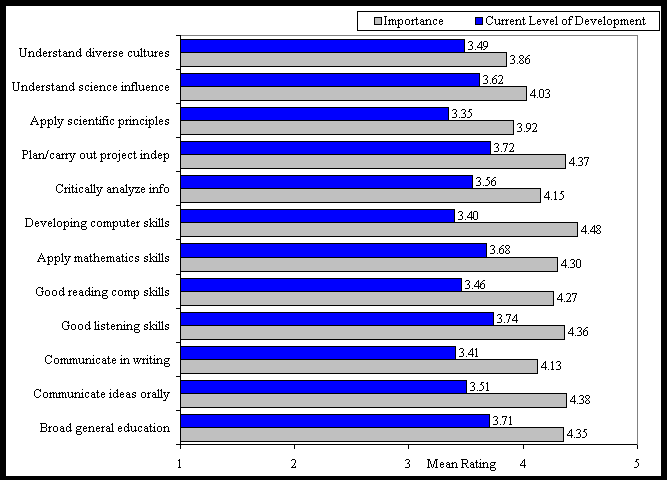
Comparing the Rank Order of Average Ratings for Current Development and Importance of Goals (Table 3-8)
Charts 3-19, 3-20, and 3-21 show that the average ratings of every goal's importance was higher than the students' ratings of their own current development in that area. However, there are some interesting variations in the rank orders of current development and importance ratings.
For example, valuing racial equity had the second highest average rating for current development, but the 18th highest average rating for importance. This can occur because the average importance ratings are generally so much higher than the development ratings. Even though the average importance rating for valuing racial equity is 4.30 and the average development rating is 4.10 (Chart 3-20), there are many importance ratings higher than 4.30 but only a few development ratings higher than 4.10. Even more strikingly disparate, the goal of valuing gender equity had the third highest average rating for current development, but was 23rd relative to other goals with respect to importance. Recognizing and acting on ethical principals and being able to interact and work with people from diverse backgrounds also ranked in the top ten goals for current development (8th and 9th respectively), but had much lower average ratings of importance relative to other goals (24th and 25th). These differences in rankings indicate that respondents appear to believe they have achieved these goals to some extent, and do not feel they are the most important ones to focus on while at NC State.
On the other hand, there are a number of goals for which respondents rate their current development relatively low compared to other goals, but to which they give relatively high importance ratings. Managing my time had the highest average rating for importance, but was ranked almost near the bottom (32nd) in current development. Respondents' average rating for handling stress ranked in 6th for importance, but 26th in current development. Developing computer skills ranked 7th in importance and 29th in current development. Thus, these are goals that are important for the students, but which, on average, they feel have not been developed to the same extent as other goals.
It is also worth noting goals that rank relatively high for both current development and importance. For example, being independent and self-reliant (6th in development and 5th in importance), and understanding own abilities and interests (7th and 9th) are ranked high in both development and importance. Ability to function as part of a team (5th in development and 11th in importance) and viewing learning as a lifelong process (4th and 16th) were ranked just slightly higher in current development compared to importance. Having self-confidence (14th in development and 3rd in importance), having self-discipline (11th and 4th), and realizing my potential for success (12th and 8th) were ranked slightly lower in current development than in importance. In general, these are goals that respondents feel are important and on which they feel they have made a good start.
Finally, there are several goals which respondents neither feel they have currently developed (relative to other goals) nor believe are important. Advancing my appreciation of the arts, music, and literature, ability to apply scientific principles, understanding issues and problems facing the world, being involved in public and community affairs, and understanding the present as it relates to history were ranked in the bottom six on both current development and importance. Thus, in general these are goals that the respondents don't seem to care much care about. Interestingly, all five are important goals of the University's core general education curriculum.
|
Goal |
Current Development |
Importance |
|
Taking responsibility for my own behavior |
1 |
2 |
|
Valuing racial equity |
2 |
18 |
|
Valuing gender equity |
3 |
23 |
|
Viewing learning as a lifelong process |
4 |
16 |
|
Ability to function as part of team |
5 |
11 |
|
Being independent and self-reliant |
6 |
5 |
|
Understanding own abilities/interests |
7 |
9 |
|
Recognizing/acting on ethical principles |
8 |
24 |
|
Being able to interact/work w/ people from diverse backgrounds |
9 |
25 |
|
Having a tolerance for different points of view |
10 |
20 |
|
Having self-discipline |
11 |
4 |
|
Realizing my potential for success |
12 |
8 |
|
Developing good listening skills |
13 |
14 |
|
Having self-confidence |
14 |
3 |
|
Ability to plan and carry out projects independently |
15 |
12 |
|
Clarifying personal identity |
16 |
26 |
|
Acquiring a broad general education |
17 |
15 |
|
Ability to apply math skills |
18 |
19 |
|
Understanding how science/technology influence everyday life |
19 |
29 |
|
Coping with change |
20 |
21 |
|
Commitment to personal health/fitness |
21 |
17 |
|
Improving leadership/management skills |
22 |
13 |
|
Ability to critically analyze events, information and ideas |
23 |
27 |
|
Ability to communicate ideas orally |
24 |
10 |
|
Understanding diverse cultures/values |
25 |
33 |
|
Handling stress |
26 |
6 |
|
Good reading comprehension skills |
27 |
22 |
|
Ability to communicate ideas in writing |
28 |
28 |
|
Developing computer skills |
29 |
7 |
|
Advancing my appreciation of the arts, music, and literature |
30 |
34 |
|
Ability to apply scientific principles |
31 |
31 |
|
Managing my time |
32 |
1 |
|
Understanding issues/problems facing the world |
33 |
30 |
|
Being involved in public/community affairs |
34 |
32 |
|
Understanding the present as relates to history |
35 |
35 |
For more information on the 1998 First Year Student Survey contact:
Dr. Nancy Whelchel, Associate Director for Survey Research
Office of Institutional Planning and Research
Box 7002
NCSU
Phone: (919) 515-4184
Email: Nancy_Whelchel@ncsu.edu
Posted: August, 1999
Download a Microsoft Word Version (Word 6.0 or higher) of this report.
We've named the file .bin so your browser gives you a download window instead of displaying the file. When you
download it you can rename it to .doc to indicate that it's a Word file.
Return to 1998 First Year Student Survey Table of Contents Page