2012 Alumni Survey
All Respondents
Table of Contents:
Overall Satisfaction
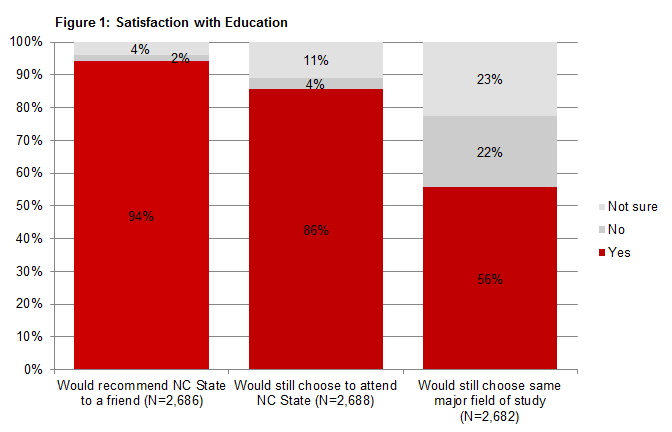
Respondents to the 2012 Alumni Survey are overwhelmingly satisfied with their educational experience at NC State, and would recommend the University to others. Over 90 percent rate their overall undergraduate education as "very strong" (52%) or "strong" (42%), and a similar number believe that NC State prepared them "a great deal" (57%) or "some" (33%) to be competitive with graduates from other institutions. Over 90 percent also say they would recommend NC State to a friend (94%), and 86% say they themselves would definitely choose to attend NC State again if they were starting over. Respondents are somewhat less certain that they would choose to study the same academic major, with just over half saying they would definitely do so (56%). The remainder are evenly divided between saying they would not choose the same major (22%) and that they are " not sure" if they would (23%).
| Mean | 4: Very strong | 3: Strong | 2: Weak | 1: Very weak | Total (N) | |
|---|---|---|---|---|---|---|
| Overall evaluation of undergraduate education at NC State | 3.46 | 52.3% | 41.9% | 5.0% | 0.7% | 2,689 |
| Mean Rating | 4: A great deal | 3: Some | 2: A little | 1: Not at all |
Total (N) | |
|---|---|---|---|---|---|---|
| NC State education prepared me to be competitive with grads from other institutions | 3.45 | 57.0% | 33.3% | 7.2% | 2.6% | 2,695 |
The extent to which one's job relates to their academic major appears to be related to whether or not they would choose the same major again. Two-thirds of alumni who say their first full-time permanent position was "directly" related to their major field of study say they would choose the same major again (68%), compared to 51 percent of those whose first full-time job was "somewhat" related and 30 percent of those who first full-time job was unrelated to their major. Almost half of those in a first job unrelated to their academic major say they would not choose the same field of study again (46%). Similarly, almost three-fourths of those whose current full-time job is "directly related" to their academic major say they would choose the same major again (73%), compared to 53 percent of those in jobs "somewhat" related and 29 percent of those in jobs that are not related to their major. Finally, alumni who went on to graduate/professional school are somewhat more likely than those who did not to say they would definitely choose the same field of study again. Alumni who had enrolled in graduate/professional school but left before completing a degree were more likely than others to say they would not choose the same major.
| If starting again, still choose same major field of study | Relationship of first full-time permanent position to academic major |
||
|---|---|---|---|
| Directly related |
Somewhat related |
Not related |
|
| Yes | 68.3% | 51.4% | 29.6% |
| No | 11.0% | 22.1% | 46.4% |
| Not sure | 20.7% | 26.6% | 24.0% |
| Total (N) | 1,160 | 625 | 530 |
| If starting again, still choose same major field of study | Relationship of current position to academic major |
||
|---|---|---|---|
| Directly related |
Somewhat related |
Not related |
|
| Yes | 73.1% | 52.7% | 28.7% |
| No | 8.5% | 20.3% | 47.2% |
| Not sure | 18.4% | 27.0% | 24.1% |
| Total (N) | 1,083 | 710 | 523 |
| If starting again, still choose same major field of study | Further education | ||||
|---|---|---|---|---|---|
| Completed degree, not currently enrolled |
Currently enrolled, already have degree |
Currently enrolled, no degree yet |
Enrolled, but no degree |
No further education | |
| Yes | 62.0% | 66.3% | 63.5% | 55.3% | 51.1% |
| No | 15.4% | 11.9% | 16.2% | 30.6% | 25.1% |
| Not sure | 22.6% | 21.8% | 20.3% | 14.1% | 23.8% |
| Total (N) | 455 | 101 | 463 | 85 | 1,578 |
Connection to NC State
Alumni were asked the extent to which they have felt a connection to NC State since receiving their undergraduate degree, and how important such a connection is to them. Over 40 percent of alumni reported feeling either "very connected" (15%) or "moderately connected" (28%) to NC State. In contrast, 42 percent of alumni overall say it is "very important" for them to feel a connection to NC State, and another 30 percent say it is "moderately important." Alumni for whom it is important to feel connected are more likely to say they have such a connection. For example, 29 percent of those who say it is "very important" to feel connected to NC State say they actually feel "very connected" to the institution. In comparison, two-thirds of those relatively few alumni who say it is "not at all important" to feel connected to NC State say they are "not at all connected." There are, however, some notable disconnects between perceptions of the importance of remaining connected to NC State and actually feeling connected. Over 10 percent of those who say it is "very important" to them to feel connected say they feel either "not very connected" (9%) or "not at all connected" (2%) to NC State.
| Connection to NC State since graduating | Importance of feeling connection to NC State | |||||
|---|---|---|---|---|---|---|
| 5: Very important |
4: Moderately important |
3: Somewhat important |
2: Not very important |
1: Not at all important |
Total (N) | |
| 5: Very connected | 28.7% | 7.3% | 3.3% | 1.9% | 3.0% | 15.1% |
| 4: Moderately connected | 36.2% | 35.1% | 10.2% | 4.7% | 1.5% | 28.2% |
| 3: Somewhat connected | 24.1% | 35.3% | 47.3% | 21.1% | 11.9% | 30.8% |
| 2: Not very connected | 9.4% | 19.7% | 34.7% | 54.9% | 17.9% | 20.6% |
| 1: Not at all connected | 1.6% | 2.6% | 4.4% | 17.4% | 65.7% | 5.2% |
| Total (N) | 42.3% | 30.4% | 16.9% | 7.9% | 2.5% | 2,688 |
Post-Graduation Activities
Two-thirds of alumni respondents indicated that their primary activity during the first year after they graduated was full-time employment (65%), and another 15 percent say they were working part-time. One-fourth of the alumni say they attended graduate/professional school either full- (22%) or part-time (3%) the year after they graduated. One percent of graduates were serving in the military immediately after graduating, and another one percent said they were a homemaker that first year. Three percent took the opportunity to spend their time in that first year traveling.
| Activity | % |
|---|---|
| Worked full-time | 64.7% |
| Worked part-time | 14.7% |
| Military service | 0.8% |
| Homemaker | 1.3% |
| Attended graduate/professional school full-time | 22.3% |
| Attended graduate/professional school part-time | 2.9% |
| Travel | 3.3% |
| Other | 5.6% |
| Total (N) | 2,855 |
Back to Top
Post-Graduation Employment
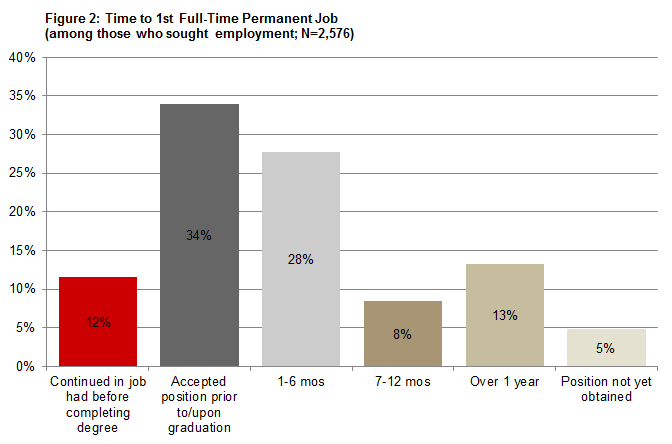
Less than half of all alumni respondents had a full-time permanent position to start immediately after graduation. About 30 percent of respondents said they had accepted an offer for a full-time permanent position by commencement day (31%), and another 11 percent said they continued in a full-time permanent position that they had begun prior to graduation. While 25 percent said they had secured a position within 6 months of graduating, 12 percent said it was over one year after graduation that they began their first full-time permanent job. Finally, 4 percent say they have looked for but been unsuccessful in finding a full-time permanent position, and 9 percent say they have not yet looked for a full-time permanent position.
| Time to get first full-time permanent job after completing undergrad degree | All respondents | |
|---|---|---|
| % | N | |
| Continued in job had before completing degree | 10.6% | 300 |
| Accepted position prior to or upon graduation | 30.9% | 876 |
| 1-6 months | 25.2% | 716 |
| 7-12 months | 7.6% | 216 |
| Over 1 year | 12.1% | 343 |
| Have looked for but not yet obtained a full-time permanent job | 4.4% | 125 |
| Have not looked for a full-time permanent job | 9.2% | 260 |
| Total | 100.0% | 2,836 |
Excluding those alumni who indicated that as of the time of the survey they had not yet looked for full-time employment provides a slightly different picture. Among those who have sought employment, 46 percent had a job immediately after graduation and 28 percent started within six months of graduation. Thirteen percent said it took over one year to find a job, and five percent of those seeking employment have not yet found a job. (As indicated below, it is likely that many of those who have thus far been unsuccessful in finding a job have recently finished a graduate/professional degree and therefore just begun their job search.)
First Permanent Full-Time Position After Graduation
This section of the report focuses on the first full-time permanent position in which NC State alumni worked after receiving their undergraduate degree. The majority of these alumni were working in jobs related to their academic major, and report having felt well-prepared by NC State for that job. The average starting salary for first-time permanent positions was about $40,500. Alumni report having used a variety of resources to obtain their first full-time position.
The majority of alumni reported that their first full-time permanent position was either "directly" (50%) or "somewhat" related (27%) to their academic major. Those in jobs unrelated to their major were equally divided between doing so "by choice" (12%) and not by choice (11%).
| % | N | |
|---|---|---|
| Directly related | 49.9% | 1,230 |
| Somewhat related | 27.2% | 671 |
| Not related (by choice) | 11.5% | 283 |
| Not related (not by choice) | 11.3% | 279 |
| Total | 100.0% | 2,463 |
Overall, alumni report feeling well prepared by NC State for their first post-graduation position. One-third say they had "excellent" preparation by NC State, and 45 percent rate their preparation as "good." Just 5 percent say their preparation for their first full-time permanent position was either only "fair" (4%) or "poor" (1%).
| Mean Rating | 5: Excellent | 4: Good | 3: Average | 2: Fair | 1: Poor | Total (N) | |
|---|---|---|---|---|---|---|---|
| Preparation by NC State for first full-time permanent position | 4.06 | 33.7% | 45.0% | 15.8% | 4.0% | 1.4% | 2,460 |
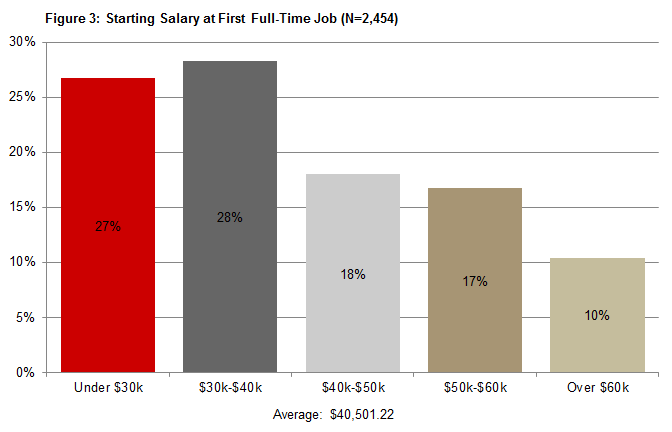
While starting salaries varied widely by the college from which one graduated, overall these alumni respondents report earning an average starting salary of $40,501 in their first full-time permanent position. Ten percent say they started off earning $60,000 or more, and 27 percent under $30,000.
Alumni used a variety of resources in their efforts to get their first full-time permanent position. Most likely to have been helpful in getting their first job were an "internship/externship" (22%), networking with "family, friends, classmates and/or co-workers" (22%), or a "personal connection within the company" (20%). Also cited by notable numbers of alumni as being helpful was "previous experience with the company" (15%), the NC State University Career Center" (14%), and "the Internet" (12%). Among those resources least likely to have been helpful in getting a job were "social networking sites," "newspapers," "employment agencies," and "search firms."
| % | |
|---|---|
| Internship/externship | 22.4% |
| Family/friends/classmates/co-workers | 22.1% |
| Personal connection(s) within the company | 20.5% |
| Previous experience with company | 15.3% |
| NC State University Career Center | 14.2% |
| Internet | 12.4% |
| On-campus interviewing or Career Fair | 9.5% |
| Applied for job via an NC State University career services job listing | 8.6% |
| Faculty member or job listing found in an NC State department | 7.4% |
| NC State co-op experience | 4.4% |
| Professional society | 3.6% |
| Employer found your resume via an NC State University career services database | 3.5% |
| NC State Alumni Association Career Services | 3.1% |
| Employment agency | 3.0% |
| Third party recruiter or executive search firm | 2.7% |
| Local, city, or national newspaper | 2.7% |
| Study Abroad or Internship/Research/Student Teaching in an international setting | 1.7% |
| Social networking site | 1.1% |
| Technician or other NC State publication | 0.5% |
| Other | 9.2% |
| Total (N) | 2,855 |
Back to Top
Current Position
This section of the report examines the current employment of alumni. As a reminder, it was between about two and one-half and five and one-half years after graduating that these alumni (who graduated in Summer 2006 through May 2009) participated in the survey and provided information about their current employment. Most of the currently employed alumni in this group are working full-time in the private sector, in a position related to their academic major, and earning an average annual salary of about $47,000. While the large majority are working in North Carolina, they are doing so in a wide range of industries. Regardless of their occupation, the majority say they were well prepared by NC State for their current position.
The majority of these alumni are currently employed full-time, with 78 percent working 35 hours per week or more. Another 8 percent are working part-time. At the time they responded to the survey 5 percent of alumni said they were unemployed and looking for work. The remaining 8 percent were not employed and not looking for work.
Current employment status, however, varies markedly by whether or not the alumus is currently enrolled in graduate/professional school, with non-students being twice as likely as those who are currently enrolled to be employed full-time (87% vs 45%, respectively). Just 2 percent of those who are not currently enrolled in graduate/professional school say they are "not employed and not seeking employment," compared to 29 percent of those who are currently enrolled.
| All Alumni | Currently Enrolled in Graduate/Professional School |
||
|---|---|---|---|
| Yes | No | ||
| Employed full-time (35+ hours per week) | 78.3% | 44.7% | 87.1% |
| Employed part-time (34 hours per week or less) | 8.4% | 19.0% | 5.6% |
| Not employed, but seeking employment | 5.4% | 7.0% | 5.0% |
| Not employed, not seeking employment | 7.9% | 29.3% | 2.3% |
| Total (N) | 2,840 | 588 | 2,240 |
At the time of the survey almost half of those currently employed alumni in full-time positions said they had been in their job less than two years (45%), with 26 percent saying they started their current position within the past year. Length of time in current position, of course, varies by when the alumus received his/her bachelor's degree from NC State. About one-fourth of those who graduated in the calendar year of 2006, 2007, or 2008 have been in their current position less than one year, compared to 31 percent of those who graduated in 2009. About 40 percent of those graduating in 2006, and 32 percent of those graduating in 2007 have been in their current position four or more years.
| Tenure in current position | All Currently Employed Alumni |
Graduation Year | |||
|---|---|---|---|---|---|
| 2006 | 2007 | 2008 | 2009 | ||
| Less than 12 months | 26.4% | 23.6% | 25.4% | 25.5% | 31.3% |
| 1 year to less than 2 years | 18.6% | 12.8% | 15.6% | 22.4% | 21.8% |
| 2 years to less than 3 years | 18.4% | 10.1% | 12.2% | 16.7% | 36.9% |
| 3 years to less than 4 years | 16.9% | 9.8% | 15.2% | 29.5% | 5.0% |
| 4 years to less than 5 years | 12.6% | 19.9% | 25.0% | 2.8% | 1.0% |
| 5 years or more | 7.1% | 23.9% | 6.6% | 3.2% | 4.0% |
| Total (N) | 2,454 | 297 | 896 | 760 | 501 |
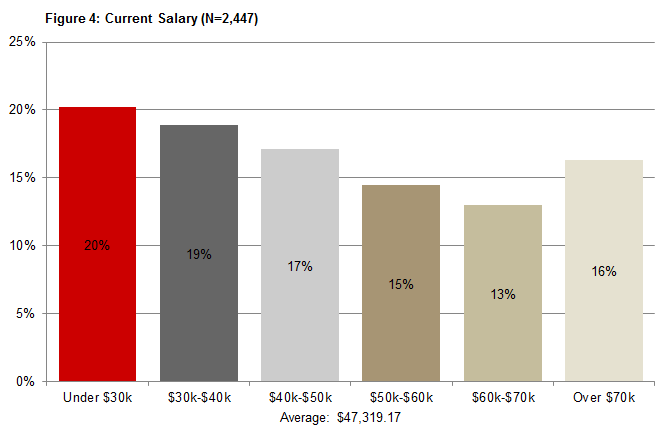
Overall, alumni report earning an average salary of $47,319 in their current full-time position. Twenty percent of alumni earn less than $30,000 in their current position, and 16 percent are earning $70,000 or more.
The majority of currently employed alumni are working in the private sector (61%). Sixteen percent work in academia, 12 percent for the federal, state, or local government, and 8 percent for a private non-profit. Relatively few alumni (3%) say they are self-employed. From a list of industries identified by the U.S. Census Bureau, alumni were most likely to select "professional, scientific, and technical services" as the industry in which they currently work (21%). That was followed by "educational services" (12%), manufacturing (9%), and "health care and social assistance" (8%). A significant number of alumni, however, seem unsure which of the industries on the list to choose, with 12 percent selecting the "other" option.
| % | N | |
|---|---|---|
| Private, for profit business or organization | 61.0% | 1,500 |
| Academic | 15.9% | 392 |
| Federal, state, or local government | 12.4% | 304 |
| Private, not for profit business or organization | 7.6% | 188 |
| Self-employed | 3.1% | 76 |
| Total | 100.0% | 2,460 |
| % | N | |
|---|---|---|
| Professional, Scientific, and Technical Services | 20.7% | 506 |
| Educational Services | 11.5% | 280 |
| Manufacturing | 9.2% | 224 |
| Health Care and Social Assistance | 8.1% | 197 |
| Finance and Insurance | 7.5% | 182 |
| Agriculture, Forestry, Fishing, and Hunting | 4.5% | 110 |
| Construction | 3.8% | 92 |
| Retail Trade | 3.6% | 89 |
| Information | 3.2% | 78 |
| Utilities | 2.7% | 66 |
| Arts, Entertainment, and Recreation | 2.5% | 62 |
| Public Administration | 1.6% | 38 |
| Accommodation and Food Services | 1.4% | 35 |
| Transportation and Warehousing | 1.2% | 30 |
| Real Estate and Rental and Leasing | 1.1% | 28 |
| Mining, Quarrying, and Oil and Gas Extraction | 0.9% | 22 |
| Wholesale Trade | 0.9% | 21 |
| Management of Companies and Enterprises | 0.7% | 18 |
| Administrative and Support and Waste Management and Remediation Services | 0.5% | 12 |
| Other Services (except Public Administration) | 1.8% | 45 |
| Other | 12.5% | 306 |
| Total | 100.0% | 2,441 |
Back to Top
Three-fourths of currently employed alumni are working in jobs either "directly" (46%) or "somewhat" related (31%) to their academic major at NC State. Unlike their first full-time permanent job, those in currently working in a position unrelated to their major are slightly more likely to be doing so "by choice" (14%) than not by choice (9%).
| % | N | |
|---|---|---|
| Directly related | 46.3% | 1,137 |
| Somewhat related | 31.1% | 763 |
| Not related (by choice) | 14.0% | 343 |
| Not related (not by choice) | 8.7% | 214 |
| Total | 100.0% | 2,457 |
Alumni give positive ratings to how well NC State prepared them for their current position, with 31 percent rating their preparation as "excellent," and 46 percent rating it as "good."
| Mean Rating | 5: Excellent | 4: Good | 3: Average | 2: Fair | 1: Poor | Total (N) | |
|---|---|---|---|---|---|---|---|
| Preparation by NC State for current position | 3.99 | 30.8% | 45.6% | 17.5% | 4.1% | 2.0% | 2,452 |
NC State alumni tend to remain in the region after graduating, with almost half of those currently employed saying they are working in the Research Triangle area (47%). Another 23 percent are working in North Carolina, but outside of the Triangle. Almost 30 percent are working out of state (29%), and one percent outside of the U.S.. One's primary residence when they first started at NC State is related to their current work location, with those from North Carolina being more likely than those from out of state to have stayed in North Carolina after graduating. About three-fourths of those currently employed alumni who were in-state residents are now working in North Carolina (71%) compared to less than half of the relatively small group of out-of-state students (44%).
| Current work location | All respondents | First semester residence | |
|---|---|---|---|
| North Carolina |
Outside North Carolina |
||
| Inside Triangle | 46.7% | 47.8% | 35.0% |
| Other NC | 22.7% | 23.6% | 9.1% |
| Other US | 29.4% | 27.3% | 54.5% |
| Outside US | 1.3% | 1.2% | 1.4% |
| Total (N) | 2,316 | 2,015 | 143 |
Back to Top
Further Education
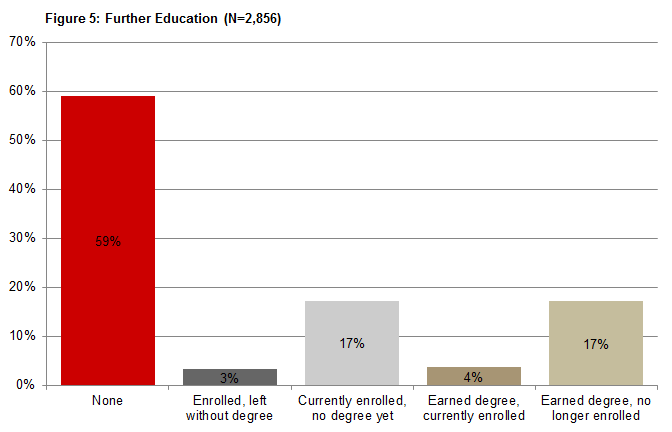
Over 40 percent of the Alumni Survey respondents have attended graduate/professional school since receiving their bachelor's degree from NC State. Seventeen percent have already completed an advanced degree. Another 4 percent already completed one advanced degree and are currently pursuing another, and 17 percent are currently seeking their first graduate/professional degree. Three percent of alumni also reported that they had been enrolled in graduate/professional school at one time, but withdrew before completing a degree.
Notable numbes of those who have never enrolled in graduate/professional school express interest in pursuing an advanced degree. Almost 30 percent of this group say they have either "high" (7%) or "moderate" (21%) interest in attending graduate/professional school. On the other hand, 32 percent of this group say they are "not at all interested" in graduate/professional school.
| Mean Rating | 4: High interest | 3: Moderate interest | 2: Low interest | 1: Not interested at all |
Total (N) | |
|---|---|---|---|---|---|---|
| Interest in continuing education in graduate/professional school | 2.04 | 7.4% | 21.4% | 39.0% | 32.3% | 1,755 |
Graduate/Professional School Experience
This section of the report provides information about those alumni who have already obtained an advanced degree or are currently enrolled and seeking a degree. Given the timing of the survey relative to when these alumni graduated (Summer 2006 through May 2009) it is not surprising that the large majority have completed a Master's degree, and a plurality of those currently enrolled seeking a Doctoral or Professional degree. The majority of those going to graduate school were/are attending a school in North Carolina, with a plurality at NC State. Most of those going on to graduate/professional school received some type of funding, and the large majority felt well prepared by their program of study at NC State for their advanced studies.
As noted above, over 20 percent of those responding to the Alumni Survey have already completed an advanced degree (21%). The majority of these alumni earned a Master's degree (88%), while 12 percent earned a Professional degree, and 1 percent a Doctoral degree. Among the 21 percent of alumni who are currently enrolled in graduate/profession school either full- (77%) or part-time (23%), almost half are seeking a Master's degree (48%), 29% a Doctoral degree, and 24 percent a Professional degree.
| Completed | Seeking | |
|---|---|---|
| Master's | 87.5% | 48.5% |
| Doctoral | 0.8% | 29.4% |
| Professional | 11.8% | 24.0% |
| Total (N) | 594 | 596 |
Back to Top
Alumni having already received or currently seeking an advanced degree were asked to indicate the specific degree program in which they were/are enrolled, and the institution(s) they attended and/or are attending. Among those already having obtained a Master's degree the most common degrees obtained include an Master of Science (38%), Master of Accounting/Accountancy (11%), Master of Arts (8%), and Master of Business Administration (8%). Among those currently enrolled in a Master's degree program a plurality are seeking a Master of Business Administration (27%), 22 percent are seeking a Master of Science, 9 percent of Master of Education, and 8 percent a Master of Arts.
| Completed | Seeking | |
|---|---|---|
| Management Information Systems | 0.4% | 0.0% |
| Master of Accounting/Accountancy | 11.0% | 0.7% |
| Master of Advanced Studies | 0.2% | 0.7% |
| Master of Architecture | 0.4% | 0.3% |
| Master of Arts | 8.1% | 8.3% |
| Master of Biological & Agricultural Engineering | 0.4% | 0.0% |
| Master of Business Administration | 7.7% | 26.6% |
| Master of City and Regional Planning | 0.2% | 0.3% |
| Master of Civil Engineering | 2.3% | 1.0% |
| Master of Clinical Research | 0.6% | 0.3% |
| Master of Computer Science | 0.4% | 0.0% |
| Master of Divinity | 0.4% | 2.4% |
| Master of Economics | 0.6% | 0.0% |
| Master of Education | 5.8% | 8.7% |
| Master of Engineering Management | 0.6% | 0.3% |
| Master of Engineering, General | 3.7% | 2.1% |
| Master of Environmental Science and Engineering | 0.0% | 0.3% |
| Master of Fine Arts | 0.6% | 1.0% |
| Master of Global Innovation Management | 1.5% | 0.0% |
| Master of Health Administration | 0.2% | 0.7% |
| Master of Health Science | 0.4% | 0.7% |
| Master of Industrial Engineering | 0.4% | 0.0% |
| Master of Information Sciences | 0.2% | 0.7% |
| Master of Landscape Architecture | 0.4% | 0.3% |
| Master of Library and Information Studies/Library Science | 1.0% | 1.0% |
| Master of Mechanical Engineering | 0.6% | 1.0% |
| Master of Medical Sciences | 0.8% | 0.0% |
| Master of Nursing | 0.0% | 0.3% |
| Master of Philosophy | 0.4% | 0.0% |
| Master of Physical Therapy | 0.4% | 0.0% |
| Master of Physician Assistant Studies | 0.4% | 1.0% |
| Master of Project Management | 0.2% | 0.0% |
| Master of Public Administration | 3.1% | 2.8% |
| Master of Public Health | 1.7% | 1.0% |
| Master of Public Policy | 0.0% | 0.7% |
| Master of School Psychology | 0.4% | 0.0% |
| Master of Science | 38.5% | 21.8% |
| Master of Social Work | 1.7% | 3.1% |
| Master of Teaching | 0.8% | 1.4% |
| Master of Textiles | 0.4% | 0.0% |
| Professional Science Master's | 0.0% | 0.7% |
| Other | 3.7% | 9.3% |
| Total (N) | 520 | 289 |
Back to Top
Very few of the Alumni Survey respondents going on to graduate/professional school have already completed a Doctoral degree (1%). However, among that small group all indicated they had completed a Doctor of Philosophy. Almost 30 percent of those currently enrolled in graduate/professional school are seeking a doctoral degree - - again, all of them a Doctor of Philosophy.
Twelve percent of those having already completed an advanced degree earned a Professional degree, most commonly a Juris Doctorate, followed by a Doctor of Veterinary Medicine. Among those currently enrolled in Professional school, about one-fourth are seeking a Juris Doctorate degree (27%), 20 percent a Doctor of Medicine, 19 percent a Doctor of Pharmacy, and 16 percent a Doctor of Veterinary Medicine.
| Completed | Seeking | |
|---|---|---|
| Bachelor of Architecture | 7.1% | 0.0% |
| Dentistry | 2.9% | 4.2% |
| Doctor of Audiology | 1.4% | 0.7% |
| Doctor of Medicine | 2.9% | 18.9% |
| Doctor of Optometry | 0.0% | 2.8% |
| Doctor of Osteopathy | 0.0% | 4.9% |
| Doctor of Pharmacy | 2.9% | 18.2% |
| Doctor of Physical Therapy | 5.7% | 3.5% |
| Doctor of Veterinary Medicine | 12.9% | 16.1% |
| Juris Doctor | 58.6% | 27.3% |
| Other | 5.7% | 3.5% |
| Total (N) | 70 | 143 |
Back to Top
The majority of those going on for a graduate/professional degree stayed in North Carolina (62%), with over one-third (36%) earning or seeking an advanced degree from NC State.
| Institution location | % | N |
|---|---|---|
| North Carolina | 62.1% | 730 |
| Outside NC, within US | 28.3% | 332 |
| Outside US | 1.6% | 19 |
| Not reported | 8.0% | 94 |
Back to Top
| Institution | % | N |
|---|---|---|
| NC State University | 36.4% | 394 |
| UNC - Chapel Hill | 6.8% | 74 |
| East Carolina University | 5.3% | 57 |
| Campbell University | 2.9% | 31 |
| Duke University | 2.6% | 28 |
View all institutions
Back to Top
Alumni were asked if they had received any type of scholarship support while attending graduate/professional school. About three in five of those going to graduate/professional school indicated that they had received such support (58%). The most common type of support was a "scholarship" (25%), followed by a "research assistantship" (23%). Less common were a "teaching assistantship" (16%) and an "honor/award" (13%). Another 11 percent indicated that they had received some "other" type of support.
| % | N | |
|---|---|---|
| Yes - Received Funding | 57.7% | 678 |
| No - Did Not Receive Any Funding | 42.3% | 497 |
| % | |
|---|---|
| Scholarship | 25.0% |
| Honor/Award | 13.4% |
| Teaching Assistantship | 15.5% |
| Research Assistantship | 23.2% |
| Other Assistantship | 10.6% |
| Total (N) | 1,175 |
Back to Top
Overall, NC State alumni report feeling well prepared for their graduate/professional school program. Ninety percent of those already completing an advanced degree say their undergraduate education did an "excellent" (50%) or "good" (40%) job preparing them for graduate/professional school. Similar ratings were given by those currently enrolled, with 46 percent saying their preparation for graduate/professional school was "excellent," and 41 percent saying it was "good."
| Mean Rating | 5: Excellent | 4: Good | 3: Average | 2: Fair | 1: Poor | Total (N) | |
|---|---|---|---|---|---|---|---|
| Among those having completed an advance degree: | 4.38 | 50.3% | 40.4% | 7.4% | 1.0% | 0.8% | 591 |
| Among those currently seeking an advance degree: | 4.31 | 45.8% | 41.4% | 10.9% | 1.7% | 0.2% | 596 |
Continuing Education
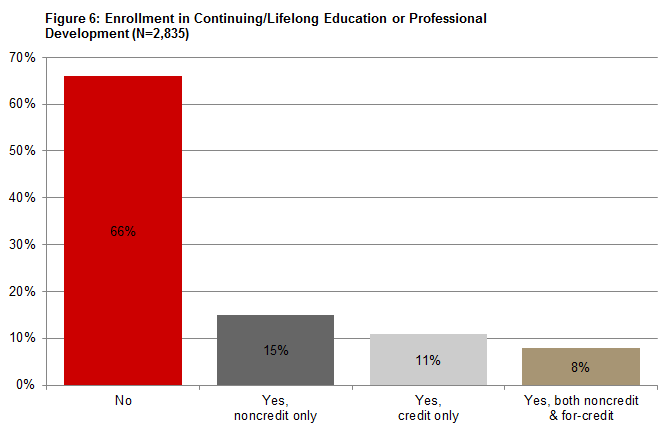
NC State alumni were asked about their participation in continuing education and/or professional development classes/programs. Fifteen percent say that since graduating they had taken a non-credit class, 11 percent have taken a for-credit course, and 8 percent have taken both for-credit and not-for-credit classes. Thirteen percent of those taking such a course did so through NC State's McKimmon Center for Extension and Continuing Education.
| % | N | |
|---|---|---|
| Yes | 12.6% | 115 |
| No | 87.4% | 796 |
| Total | 100.0% | 911 |
Back to Top
A majority of those taking a continuing education/professional development course report that it had a significant impact on their professional and/or personal life. About one-fourth say the course(s) had a "very significant" impact on their professional career (26%), and another 41 percent say it had a "somewhat significant" impact. Similar numbers say the course(s) had a "very significant" (29%) or "somewhat significant" (41%) impact on their personal life.
| Impact of continuing educ/prof development/lifelong educucation on: | Mean Rating |
4: Very significant impact |
3: Somewhat significant impact |
2: Limited impact |
1: No impact at all |
Total (N) |
|---|---|---|---|---|---|---|
| Professional career | 2.85 | 25.9% | 40.9% | 25.4% | 7.8% | 959 |
| Personal goals/life enrichment | 2.95 | 29.2% | 41.3% | 24.7% | 4.9% | 960 |
Alumni appear likely to enroll in continuing education/professional development courses in the future, with 20 percent saying it is "very likely" and 38 percent saying it is "somewhat likely" that they will take a continuing education or professional development course at some time in the future. Only 11 percent say it is "not at all likely" that they will pursue such educational opportunities in the future. Those already having taken a continuing education or professional development course are somewhat more likely than those who have not to say it is "very likely" they will do so again in the future (28% vs 16%).
| Likelihood of Enrolling | All respondents | Post-undergraduate enrollment in continuing educ/ prof development/ lifelong educ | |
|---|---|---|---|
| Yes | No | ||
| 4: Very likely | 20.1% | 28.3% | 15.9% |
| 3: Somewhat likely | 37.5% | 37.0% | 37.8% |
| 2: Not very likely | 31.0% | 26.0% | 33.6% |
| 1: Not at all likely | 11.3% | 8.6% | 12.7% |
| Total (N) | 2,831 | 960 | 1,870 |
The extent to which alumni perceive that their NC State undergraduate education contributed to their valuing learning as a lifelong process has essentially no relationship to their participation in continuing education or professional development courses since graduating. For example, between 66 percent and 69 percent of alumni say they have not taken any such course, regardless of whether they think NC State contributed "a great deal" or "not at all" to their valuing learning as a lifelong process.
| Post-undergraduate enrollment in continuing educ/prof development/lifelong educ | Preparation to valuing learning as a lifelong process | |||
|---|---|---|---|---|
| 4: Very much | 3: Somewhat | 2: Very little | 1: Not at all | |
| No | 65.8% | 65.8% | 67.9% | 69.4% |
| Yes- noncredit enrollment only | 15.0% | 16.0% | 16.0% | 16.3% |
| Yes- credit-based enrollment | 11.2% | 9.9% | 11.8% | 6.1% |
| Yes- both noncredit and credit-based enrollment | 8.0% | 8.3% | 4.3% | 8.2% |
| Total (N) | 1,353 | 1,009 | 187 | 49 |
Undergraduate Education Goals
NC State has a range of educational goals for our undergraduate students, including those related to communication, critical and creative thinking, professionalism, general education, and diversity and global awareness. Respondents to the Alumni Survey were asked how important a number of specific skills related to each of these areas are to them currently, and the extent to which NC State helped them to acquire each of those skills. Overall, alumni believe each of these specific skills to be important, and, although ratings for preparation are consistently lower than ratings for importance for a given item, they feel like NC State did a good job helping them develop such skills. Skills related to communication tended to be more highly rated in importance than other skills, while those related to general education and diversity and global awareness were seen as less important. In terms of how well prepared alumni feel they were through their NC State education, highest overall ratings are given to preparation on skills related to critical and creative thinking and to communication, and lowest ratings to diversity and global awareness and to professionalism. In this section of the report we first look at overall results for the 48 individual skills asked about, then focus specifically on items related to each general area.
Overall Importance of Skills
Average importance ratings for the 48 individual goals asked about range from a high of 3.9 to a low of 2.7 (on a 4-point scale). At least half the respondents rate all but 15 of the items as "very important," and for only 5 items do more than 10 percent of respondents say the skill is "not at all important." Most likely to be seen as "very important" by alumni are
- Communication skills overall (91%)
- Understanding written and oral information (91%)
- Problem solving skills overall (88%)
- Conducting work activities in an ethical manner (88%)
- Professional skills overall (84%)
- Working under pressure (82%)
- Adapting to changing circumstances (81%)
Most likely to considered by alumni as "not at all important" to them currently are
- Appreciating the arts (17%)
- Appreciating the humanities (14%)
- Appreciating differences in sexual orientation (13%)
- Applying social science methods to understand human behavior (12%)
Overall Preparation for Skills
Average preparation ratings for the individual items range from a high of 3.7 to a low of 2.6 (on a 4-point scale). While few alumni indicate that NC State had "not at all" contributed to their development of a skill, for only 9 of the 48 items do half or more of the respondents say that NC State contributed "very much" to their development of it. Skills for which NC State is most likely to have contributed "very much" are
- An overall general education (72%)
- Working independently (54%)
- Working under pressure (54%)
- Working in teams (54%)
- Understanding written and oral information (52%)
- Valuing learning as a lifelong process (52%)
- Problem solving skills overall (52%)
- Understanding the basic concepts in a broad range of disciplines (51%)
- Applying mathematics skills (50%)
Alumni are most likely to say that NC State contributed "not at all" to their development of
- Appreciating differences in sexual orientation (16%)
- Appreciating the arts (11%)
- Understanding issues associated with gender equity (9%)
- Understanding issues associated with racial equity 8%)
- Being involved in public and community affairs (7%)
- Developing and maintaining a healthy lifestyle (7%)
- Applying social science methods to understand human behavior (7%)
Overall Importance Compared to Preparation
As noted above, with few exceptions on average alumni give higher ratings to the importance of a skill than to the extent to which NC State contributed to their development of that skill. However, in general, alumni give similar relative ratings to the importance of a skill and their preparation for the skill. That is, if a skill ranks high relative to other skills in importance it typically also ranks high relative to other items in preparation. For example,
There are a few notable exceptions to skills having similar relative rankings. Some skills have an average importance rating that is relatively high compared to other skills, but have an average preparation rating that is relatively low compared to other skills. These include
Conversely, some skills are rated as relatively less important that others, but alumni feel they were relatively better prepared on them. These include
Another way to look at this is to examine the differences in the average importance and preparation ratings, irrespective of their rank relative to other skills. The "gap" between ratings were largest for
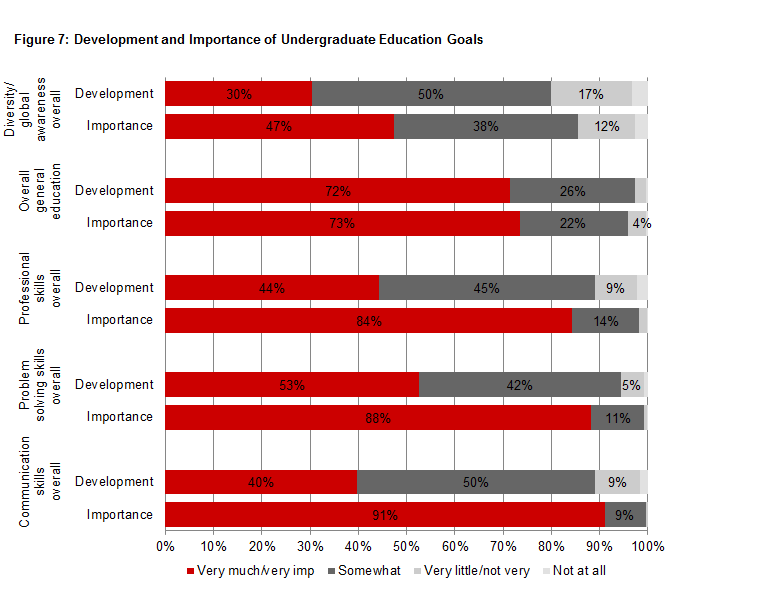
Figure 7 below presents a visual display of the differences in "preperation" versus "importance" for the summary measures for each of the respective areas asked about. Again, highlighting the "gap" for communications skills overall, we find that 91 percent of alumni say such skills are "very important" but only 40 percent say NC State contributed "very much" to their development of them. There are also large discrepencies in ratings for professional skills overall, problem solving skills overall, and, to a lesser extent, diversity/global awareness overall. The only summary measure for which there is no difference in ratings is for overall general education, with 73 percent of alumni saying this learning outcome is "very important" and 72 percent saying NC State contributed "very much" to their development of it.
Overall, communication skills were rated as more important than other types of skills. The ability to understand written and oral communication is nearly universally judged by alumni to be an important skill, with 91 percent of respondents rating it as "very important." While writing effectively and speaking to large and small groups and making presentations are also seen as currently important by alumni, they are less likely to be judged "very important" (68% and 62%, respectively).
Alumni are satisfied with how well NC State prepared them with respect to communication skills, but there does appear to be room for improvement - - the overall "gap" between importance and preparation ratings for communication skills is larger than that for others areas asked about. NC State got the highest marks for helping to develop skills related to understanding written and oral communication, with 52 percent saying the University contributed "very much" and 42 percent saying it contributed "somewhat" to their development of this skill. Although still rated favorably by majorities of alumni, NC State gets lower ratings for their contribution to writing effectively and speaking to large and small groups and making presentations. Less than 40 percent say the University contributed "very much" to their development of these skills (38% and 39%, respectively), and almost 15 percent rate NC States" contribution as only "very little" or "not at all."
Alumni Survey respondents were asked about 11 different specific skills related to critical and creative thinking. Each of the 11 skills is rated as "very important" by a majority of alumni. Most likely to be seen as "very important" are
Although still seen as "very important" by a majority of respondents, skills related to critical and creative thinking that are judged to be somewhat less important are
Alumni generally believe that they are well prepared for critical and creative thinking. For each specific skill one-third or more respondents say NC State did contributed "very much" to their development of it. Critical and creative thinking skills for which respondents are most likely to believe NC State contributed "very much" to their development are
Critical and creative thinking skills on which alumni feel less well prepared, saying that NC State contributed only "very little" or "not at all" to their development of, include
A wide range of professional skills are viewed as "very important" by NC State alumni. Over 80 percent of alumni rate several of the 10 specific skills as "very important":
Although still seen as "very important" by a majority of respondents, skills related to professionalism that are viewed as relatively less important are
Although alumni generally feel that they were well prepared with respect to professionalism, differences in average ratings of the importance of the individual skills and ratings for preparation for them is relatively large compared to skills in other areas. Alumni indicate NC State contributed the most to their development of
Fifteen percent or more alumni say that NC State contributed "very little" or "not at all" to their development of
Two-thirds or more of alumni rate four of the 14 specific skills related to an overall general education as "very important" to them currently.
Skills related to general education are among those seen as least important by alumni, with 5 of the items being rated as "not very important" or "not at all important" by 25 percent or more of respondents.
In only a few cases do half or more alumni indicate that NC State contributed "very much" to their development of skills related to an overall general education.
One-fourth or more of alumni say that NC State contrinuted "very little" or "not at all" to
Although 40 percent or more alumni rate all but one of the skills related to diversity and global awareness as "very important," skills in this area are typically seen by alumni as relatively less important than skills in other areas. Most likely to be rated as "very important" are
Seen as "not very" or "not at all important" in their current lives by one-fourth or more respondents are
Overall, relative to other areas asked about NC State alumni are least likely to say the University made a significant contribution to their development to skills related to diversity and global awareness. The only specific item for which more than one-third of alumni say NC State contributed "very much" to their development is having a tolerance for different points of view (40%). More than one-third of alumni say that NC State contributed "very little" or "not at all" to their development of
Alumni were asked about their participation in a variety of educational and co-curricular experiences and activities while an undergraduate student at NC State, and, for some experiences, the impact it had on their professional and/or personal lives. About half of the alumni said they had travelled abroad while an undergraduate, with about 25 percent participating in Study Abroad or an NC State service trip. A large number of alumni obtained work-related experience as an undergraduate, with over 40 percent saying they had had an internship/externship, 11 percent had had a student teaching assignment, and eight percent participated in a Cooperative Education program. The large majority of alumni had been engaged in student organizations, with a sizable number of them saying they had played a leadership role in at least one such organization. Overall, we find that engagement in these various educational and/or co-curricular activities has a lasting, positive impact on students.
Alumni were asked the extent to which various experiences they might have had while an undergraduate at NC State impacted their current professional or personal lives. From among the activities asked about, a co-op, internship or student teaching were most likely to have had a lasting impact, followed by participating in undergraduate research, and participating in community service or a service learning project. (In the following summary of results those alumni selecting the "not applicable" response option, indicating they had not had the experience as an undergraduate, are excluded from the analysis.)
About two-thirds of alumni "agree" that participation in an internship/co-op/student teaching has had a positive impact on my career (69%), and another 18 percent "tend to agree." Forty-five percent of alumni "agree" and 32 percent "tend to agree" that knowledge/experiences from undergraduate research have had a positive impact on my career.
Three-fourths of alumni either "agree" (40%) or "tend to agree" (35%) that community service or a service learning project has had a positive impact on my commitment to helping to improve society.
Foreign language courses taken at NC State also had a lasting impact on alumni, with 26 percent agreeing and another 30 percent saying they "tend to agree" that such courses helped me gain an appreciation for other cultures. However, alumni are less likely to "agree" (19%) or "tend to agree" (19%) that the ability to communicate in a language other than English has proven helpful in my current profession. One-fourth of alumni "disagree" and another 12 percent "tend to disagree" that speaking another language is helpful in their current career.
A majority of alumni indicate that their physical education course(s) at NC State had a long-term effect. Sixty percent "agree" (31%) or "tend to agree" that such courses had a positive influence on their current exercise/health habits.
Finally, about half of alumni either "agree" (21%) or "tend to agree" (31%) that attending ARTS NC State events increased my interest in attending future arts/cultural events.
Alumni were asked about various on- and off-campus international experiences they might have had as an undergraduate at NC State. This section of the report focuses on the extent of participation in such activities, and the impact of those experiences on various on learning outcomes.
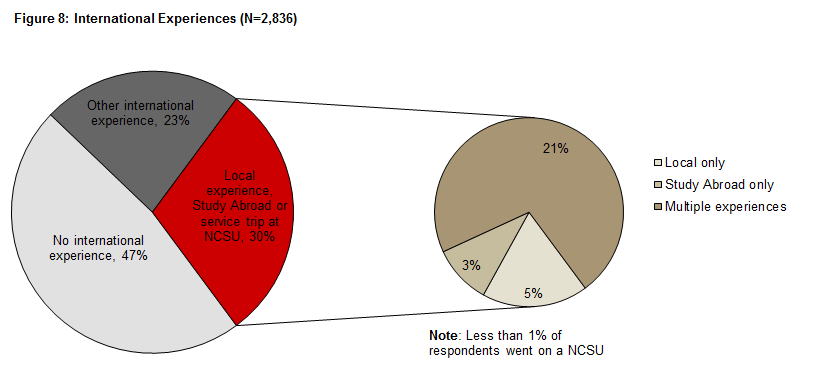
One-fourth of those responding to the survey say they had participated in an on-campus international program or activity, and almost one-half say they had had at least one type of international experience outside the U.S. during their time as an undergraduate at NC State (47%). [Note that this information does not capture the total number of times an alumni travelled abroad as an undergraduate, but rather the different reasons for which they had such an experience(s).] While 36 percent of alumni say they had travelled abroad for personal reasons, 17 percent say they did a Study Abroad for either a summer or short-term session (12%) and/or for a semester or longer (5%). Three percent say they went on an international service trip organized by NC State, and a similar number say they went on a non-NC State service trip. A very small number of alumni say they had travelled abroad for other reasons, such as to work on a research project or for an internship.
Altogether, 30 percent of alumni indicated having some international experience (either a local activity or something outside of the US) specifically sponsored or organized by NC State, with the majority of them having multiple types of experiences. Another 23 percent had travelled abroad only for other reasons, unrelated to NC State. In what follows we focus exclusively on the findings from those who had an on-campus international experience, and/or who did a Study Abroad or service trip through NC State.
Alumni having had an NC State organized international experience were asked the impact it had for them on four different learning outcomes. Over 70 percent of alumni with such international experience say it did "a great deal" to help them appreciate diverse perpectives and cultures (72%), and 61 percent say it did "a great deal" to help them better understand problems and issues facing the world. About half of these alumni say their international experience did "a great deal" to positively impact their work attitudes and skills. A smaller number believe their international experience did "a great deal" to improve their problem solving skills (39%).
The extent to which alumni feel these learning outcomes were achieved varies somewhat by the type of international experience they had as an undergraduate. Those with only a local experience (i.e., participating in an on-campus international activity) are consistently least likely to believe that experience(s) contributed "a great deal" to the various learning outcomes. However, there are few differences in ratings between those with different types of experiences that actually took them outside the U.S.. Some notable findings related to the type of experience and its impact on learning outcomes are:
Alumni who indicated that they had not participated in an NC State organized Study Abroad trip and/or a service learning trip were asked the reason(s) why they had not done so. About half of these alumni say "financial constraints" kept them from doing a Study Abroad (53%) or a service learning trip (49%). One-third of those not participating in a Study Abroad say it was due to "limited flexibility in major" (33%). About one-fourth of the alumni who did not do a Study Abroad and/or a service learning trip cited "personal, family, or employment obligations" as keeping them from having such an international experience (28% and 25%, respectively), while slightly fewer say they did not do so because they "learned about opportunities too late" (18% and 20%, respectively). Alumni, however, were slightly more likely to have not participated in a service learning trip compared to a Study Abroad trip because they were "not interested in available programs" (32% and 22%, respectively). Only 4 percent of alumni indicate that "my own/my family's concern about safety" was a reason for not participating in a Study Abroad and/or service learning trip.
Alumni report having had a number of different work-related experiences while an undergraduate at NC State. The most commonly reported such experience was an internship/externship (44%), followed by summer employment or a part-time job in which the work was related to their academic major (35%). Another 11 percent said they got work-related experience through student teaching (11%), and 8 percent say they have participated in a Cooperative Education Program. Twenty-percent of alumni say they worked on a research project with a faculty member while an undergraduate.
Alumni were asked about their participation in various different student organizations while they were at undergraduate student at NC State. Organization/clubs with an academic focus were popular among alumni, with 40 percent saying they participated in an "organization/club related to their major," and 21 percent in an "honor/professional fraternity/sorority." Over 30 percent say they participated in "intramural/recreation sports or club teams" (31%). Other activities in which more than 10 percent of the alumni say they participated are "service group/organization" (17%), "University Scholars Program" (16%), "religious groups" (15%), and "social fraternity/sorority" (14%). Altogether, 81 percent of the alumni indicated that they had participated in at least one of the different groups/organizations asked about (including "other"), and 11 percent said that had participated in five or more of the groups asked about.
Alumni who indicated that they had participated in any of the different types of clubs/organizations listed were asked if they had held a "significant leadership role" in any of those clubs/organizations. Fully half of those participating in a club/organization while at NC State say they held such a leadership position. These leadership experiences had a positive impact on students, with 63 percent of those who say that NC State contributed "very much" to their ability to effectively lead or guide others having held such a leadership position while an undergraduate. In contrast, two-thirds of those who say NC State contributed "very little" and 72 percent of those who say NC State contributed "not at all" to their ability to effectively lead or guide others" had not had a leadership position in a club/organization.
Alumni were asked a number of questions about their current behaviors with respect to community service, physical exercise, participation in the arts, keeping up with current events and pleasure reading. In this section of the report we present these results, along with the extent to which NC State might have contributed to such behaviors. Overall, almost 40 percent of alumni report that they volunteer their time about once per month or more, and almost 90 percent say they exercise at least once per week. One-third say they typically attend an arts/cultural event about once per month or more. Finally, while the majority of alumni say they keep up with current events on a regular basis, they are less likely to regularly read for pleasure. For the most part, it appears that experiences at NC State had a positive impact on such current behaviors.
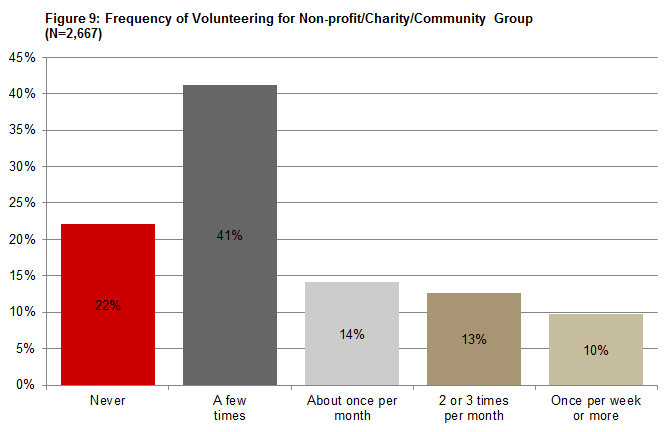
Almost 40 percent alumni say they volunteer for a non-profit, charity, or community group once or month or more, with 10 percent saying they do so at least once per week. Over 20 percent, however, say they "never" participate in such volunteer activities (22%). Alumni who volunteer once per month or more frequently are more likely than those who never or rarely volunteer to say that their college education contributed "very much" to their being involved in public and community affairs". For example, 36 percent of those who currently volunteer "once per week or more" compared to 13 percent of those who "never" volunteer, say that NC State contributed "very much" to this outcome.
Current volunteer activities are also associated with participation in community service/service learning projects while at NC State, and the extent to which alumni think such experiences impacted their commitment to helping to improve society. About 40 percent of those who volunteer once a month or more "agree" that their participation in community service/service learning activities as an undergraduate had such an impact. In contrast, the majority of alumni who say they "never" volunteer for a non-profit, charity, or community group indicate that neither did they participate in a community service or service learning project while an undergraduate student at NC State (58%). However, one-fourth or more of those who currently volunteer their time with any frequency also did not participate in a community service or learning project while an undergraduate.
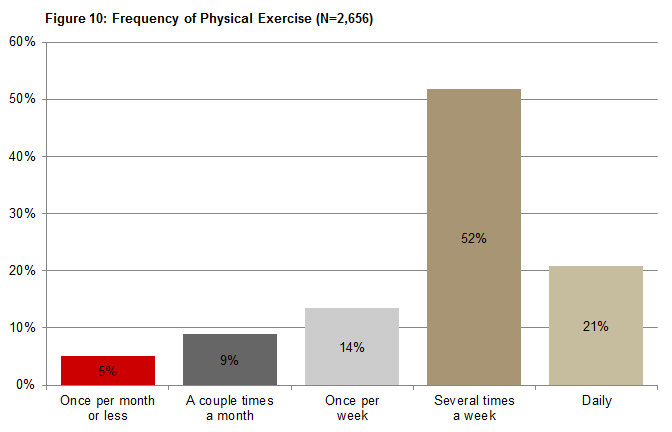
The large majority of alumni indicate they engage in physical exercise at least once per week (86%), with 21 percent saying they exercise on a daily basis.
The more frequently one currently exercises the more likely they are to believe that their undergraduate education played a role in such behaviors. Over 40 percent of those who exercise on a daily basis, compared to about 10 percent of those who do so less than once per week, "agree" that their physical education course(s) at NC State had a positive influence on their current exercise/health habits. Similarly, almost 40 percent of those who exercise on a daily basis, compared to about 15 percent of those who do so less than once per month, believe that their college education contributed "very much" to developing and sustaining an active and healthy lifestyle.
While a notable number of NC State alumni say they "never" attend arts or cultural events (15%), one-third say they attend such events about once per month or more.
Alumni who regularly attend arts/cultural events are much more likely to agree that attending ARTS NC State events while a student increased their interest in attending such events in the future. For example, 30 percent of those who attend an arts/cultural event "more than once per month," compared to just 3 percent of those who "never" do so, "agree" that attending ARTS NC State events increased their interest in participating in such events in the future. Similarly, over 60 percent of those who do not currently attend arts/cultural events did not attend ARTS NC State events while an undergraduate, compared to just 17 percent of those who currently attend "more than once per month."
The majority of alumni (56%) say they keep up with current events in the news "daily," and another 26 percent do so "several times a week."
Alumni are less likely to read for pleasure, with just 24 percent saying they do so "daily," and 29 percent "several times a week." Thirteen percent of alumni say they read for pleasure "less than once per month" (9%) or "never" (4%).
Posted: July, 2012
View Frequencies
Mean
ImportanceMean
PreparationRelative Rank
(Importance/Preparation)
Communication skills overall
3.91
3.27
1/19
Understanding written and oral information
3.90
3.45
2/4
Problem solving skills overall
3.87
3.46
3/2
Conducting work activities in an ethical manner
3.86
3.31
4/14
Professional skills overall
3.82
3.31
5/16
Working under pressure
3.79
3.43
6/7
Adapting to changing circumstances
3.78
3.15
7/30
Defining problems
3.76
3.34
8/11
Valuing learning as a lifelong process
3.75
3.41
9/9
Recognizing and acting on ethical principles
3.73
3.23
10/22
Keeping current with skills/knowledge in my field
3.73
3.13
11/31
Critically analyzing and evaluating ideas/information
3.72
3.43
12/8
Examining problems from multiple perspectives
3.72
3.30
13/18
Identifying relevant ideas/information
3.69
3.33
14/13
Working independently
3.69
3.45
15/5
An overall general education
3.69
3.68
16/1
Having a tolerance for different points of views
3.65
3.24
17/21
Working in teams
3.64
3.45
18/3
Writing effectively
3.62
3.22
19/23
Breaking down complex topics to enhance understanding
3.62
3.31
20/15
Integrating ideas/information from multiple sources
3.60
3.34
21/12
Effectively leading/guiding others
3.56
3.06
22/36
Using information technologies and search strategies to access information
3.56
3.30
23/17
Developing and sustaining an active and healthy lifestyle
3.55
2.92
24/42
Preparing for a career
3.54
3.17
25/29
Constructing clear, precise, and accurate arguments
3.52
3.20
26/28
Generating innovative solutions
3.50
3.11
27/33
Speaking to small and large groups and making presentations
3.49
3.21
28/26
Understanding the basic concepts in a broad range of disciplines
3.47
3.44
29/6
Understanding issues and problems facing the world
3.41
3.01
30/38
Understanding diverse cultures and values
3.40
3.11
31/34
Combining/synthesizing existing ideas/information in original ways
3.37
3.13
32/32
Working with people from diverse cultural backgrounds
3.36
3.20
33/27
Exploring and synthesizing approaches/views from more than one discipline
3.34
3.24
34/20
Diversity/global awareness overall
3.30
3.07
35/35
Applying mathematics skills
3.26
3.35
36/10
Understanding the present as it relates to historical events/processes
3.23
2.95
37/41
Understanding the commonality of human problems through a global perspective
3.22
2.95
38/40
Understanding how science and technology influence society and everyday life
3.18
3.21
39/24
Understanding issues associated with racial equity
3.12
2.81
40/45
Being involved in public and community affairs
3.11
2.89
41/43
Understanding issues associated with gender equity
3.10
2.79
42/46
Formulating and testing hypotheses
3.03
3.21
43/25
Acquiring an awareness of new scientific knowledge and discoveries
2.94
3.04
44/37
Appreciating differences in sexual orientation
2.89
2.61
45/48
Applying social science methods to understand human behavior
2.81
2.87
46/44
Appreciating the humanities
2.76
2.97
47/39
Appreciating the arts
2.67
2.73
48/47
Back to Top
Communication Skills
View Frequencies
Mean
ImportanceMean
PreparationRelative Rank
(Importance/Preparation)
Communication skills overall
3.91
3.27
1/2
Understanding written and oral information
3.90
3.45
2/1
Writing effectively
3.62
3.22
3/3
Speaking to small and large groups and making presentations
3.49
3.21
4/4
Back to Top
Critical and Creative Thinking
View Frequencies
Mean
ImportanceMean
PreparationRelative Rank
(Importance/Preparation)
Problem solving skills overall
3.87
3.46
1/1
Defining problems
3.76
3.34
2/3
Critically analyzing and evaluating ideas/information
3.72
3.43
3/2
Examining problems from multiple perspectives
3.72
3.30
4/8
Identifying relevant ideas/information
3.69
3.33
5/5
Breaking down complex topics to enhance understanding
3.62
3.31
6/6
Integrating ideas/information from multiple sources
3.60
3.34
7/4
Using information technologies and search strategies to access information
3.56
3.30
8/7
Constructing clear, precise, and accurate arguments
3.52
3.20
9/9
Generating innovative solutions
3.50
3.11
10/11
Combining/synthesizing existing ideas/information in original ways
3.37
3.13
11/10
Back to Top
Professionalism
View Frequencies
Mean
ImportanceMean
PreparationRelativeRank
(Importance/Preparation)
Conducting work activities in an ethical manner
3.86
3.31
1/4
Professional skills overall
3.82
3.31
2/5
Working under pressure
3.79
3.43
3/3
Adapting to changing circumstances
3.78
3.15
4/8
Keeping current with skills/knowledge in my field
3.73
3.13
5/9
Working independently
3.69
3.45
6/2
Working in teams
3.64
3.45
7/1
Effectively leading/guiding others
3.56
3.06
8/10
Preparing for a career
3.54
3.17
9/7
Working with people from diverse cultural backgrounds
3.36
3.20
10/6
Back to Top
General Education
View Frequencies
Mean
ImportanceMean
PreparationRelative Rank
(Importance/Preparation)
Valuing learning as a lifelong process
3.75
3.41
1/3
Recognizing and acting on ethical principles
3.73
3.23
2/6
An overall general education
3.69
3.68
3/1
Developing and sustaining an active and healthy lifestyle
3.55
2.92
4/11
Understanding the basic concepts in a broad range of disciplines
3.47
3.44
5/2
Exploring and synthesizing approaches/views from more than one discipline
3.34
3.24
6/5
Applying mathematics skills
3.26
3.35
7/4
Understanding how science and technology influence society and everyday life
3.18
3.21
8/7
Being involved in public and community affairs
3.11
2.89
9/12
Formulating and testing hypotheses
3.03
3.21
10/8
Acquiring an awareness of new scientific knowledge and discoveries
2.94
3.04
11/9
Applying social science methods to understand human behavior
2.81
2.87
12/13
Appreciating the humanities
2.76
2.97
13/10
Appreciating the arts
2.67
2.73
14/14
Back to Top
Diversity and Global Awareness
View Frequencies
Mean
ImportanceMean
PreparationRelative Rank
(Importance/Preparation)
Having a tolerance for different points of views
3.65
3.24
1/1
Understanding issues and problems facing the world
3.41
3.01
2/4
Understanding diverse cultures and values
3.40
3.11
3/2
Diversity/global awareness overall
3.30
3.07
4/3
Understanding the present as it relates to historical events/processes
3.23
2.95
5/6
Understanding the commonality of human problems through a global perspective
3.22
2.95
6/5
Understanding issues associated with racial equity
3.12
2.81
7/7
Understanding issues associated with gender equity
3.10
2.79
8/8
Appreciating differences in sexual orientation
2.89
2.61
9/9
Back to Top
Undergraduate Experiences
Impact of Various Undergraduate Experiences
Note: Table excludes "not applicable" response option.
Mean
Rating5: Agree
4: Tend to agree
3: Neither agree
nor disagree2: Tend to disagree
1: Disagree
Total (N)
Physical ed course(s) had a positive influence on my current exercise/health habits
3.61
30.6%
28.8%
21.5%
8.8%
10.3%
2,580
Attending ARTS NC State events increased my interest in attending future arts/cultural events
3.46
21.3%
31.1%
29.6%
8.0%
9.9%
1,602
Ability to communicate in a language other than English has proven helpful in current position
2.94
19.3%
18.7%
24.1%
12.2%
25.7%
1,607
Foreign language courses helped me gain an appreciation for other cultures
3.48
25.5%
30.3%
23.5%
8.2%
12.5%
1,563
Participation in an internship/co-op/student teaching has had a positive impact on career
4.48
68.9%
17.8%
8.9%
1.8%
2.7%
1,697
Knowledge/experiences from undergraduate research have had a positive impact on career
4.12
44.9%
32.5%
15.8%
2.9%
3.8%
1,825
Community service/service learning project has had impact on commitment in helping to improve society
4.05
40.1%
35.0%
18.5%
3.1%
3.3%
1,705
Back to Top
International Experiences
Note: Table excludes "not sure/don't know" response option.
%
N
Yes - participated
24.5%
655
No - did not participate
75.5%
2,014
Total
100.0%
2,669
Back to Top
Note: Respondents could provide more than one response.
%
Personal travel outside the US
36.5%
Study abroad for a summer or short term
12.5%
Study abroad for one semester or longer
4.9%
International service trip organized outside NC State
3.3%
International service trip organized by NC State
3.3%
Research project outside the US
1.7%
Work outside the US
1.5%
International internship
1.1%
Student teaching outside the US
0.2%
Total (N)
2,836
Back to Top
Back to Top
%
N
No International Travel
52.7%
1,495
One
33.7%
957
Two or more
13.5%
384
Total
100.0%
2,836
Back to Top
Mean Rating
4: A great deal
3: Some
2: A little
1: Not at all
Total (N)
Helped appreciate diverse perspectives/different cultures
3.60
71.4%
20.4%
5.3%
2.8%
812
Helped to better understand world problems/issues
3.44
59.9%
28.5%
6.8%
4.8%
811
Had a positive impact on work attitudes/skills
3.29
51.2%
32.6%
10.4%
5.8%
809
Helped improve problem solving skills
3.07
39.0%
38.3%
13.6%
9.1%
810
Note: "Multiple experiences" indicates that respondents reported two or more international experiences.
Helped improve problem solving skills
International experience
Local experience only
Study abroad
only NCSU Service trip
only Multiple experiences
4: A great deal
17.2%
39.0%
.
43.9%
3: Some
32.0%
40.2%
100.0%
38.6%
2: A little
18.9%
13.4%
.
12.7%
1: Not at all
32.0%
7.3%
.
4.8%
Total (N)
122
82
7
599
Back to Top
Note: "Multiple experiences" indicates that respondents reported two or more international experiences.
Had positive impact on work attitudes/skills
International experience
Local experience
only Study abroad
only NCSU Service trip
only Multiple experiences
4: A great deal
23.8%
39.0%
57.1%
58.4%
3: Some
34.4%
40.2%
42.9%
31.1%
2: A little
19.7%
13.4%
.
8.2%
1: Not at all
22.1%
7.3%
.
2.3%
Total (N)
122
82
7
598
Back to Top
Note: "Multiple experiences" indicates that respondents reported two or more international experiences.
Helped to better understand world problems/issues
International experience
Local experience
only Study abroad
only NCSU Service trip
only Multiple experiences
4: A great deal
28.5%
54.9%
71.4%
66.9%
3: Some
37.4%
32.9%
28.6%
26.0%
2: A little
13.8%
7.3%
.
5.3%
1: Not at all
20.3%
4.9%
.
1.7%
Total (N)
123
82
7
599
Back to Top
Note: "Multiple experiences" indicates that respondents reported two or more international experiences.
Helped to appreciate diverse perspectives/different cultures
International experience
Local experience
only Study abroad
only NCSU Service trip
only Multiple experiences
4: A great deal
39.5%
64.6%
71.4%
79.0%
3: Some
35.5%
24.4%
28.6%
16.7%
2: A little
11.3%
8.5%
.
3.7%
1: Not at all
13.7%
2.4%
.
0.7%
Total (N)
124
82
7
599
Back to Top
Note: Respondents could provide more than one response.
Study
AbroadService
Learning
Financial constraints
53.1%
48.8%
Limited flexibility in major
33.3%
na
Personal, family, or employment obligations
28.1%
24.7%
Not interested in available programs
22.5%
31.8%
Learned about opportunities too late
18.0%
20.5%
My own/my family's concerns about safety
4.1%
3.5%
Other
7.5%
8.1%
Total (N)
2,364
2,655
Back to Top
Work-Related Experiences
Note: Respondents could provide more than one response.
Had Experience
%
Internship/externship
44.3%
Summer employment or part-time job in major
34.7%
Research with faculty
19.8%
Student teaching
10.9%
Cooperative Education Program
8.0%
Residence advisor
3.2%
Practicum
2.8%
Other on-campus employment
23.2%
Total (N)
2,836
Back to Top
Participation in Student Organizations
Note: Respondents could provide more than one response.
Yes - Participated
%
Organizations/clubs related to major
39.8%
Intramural/Recreational sports, club teams
30.7%
Honor/professional fraternity/sorority
21.1%
Service group/organization
17.0%
University Scholars Program
16.4%
Religious groups
15.3%
Social fraternity/sorority
14.1%
Academic scholarship program
6.9%
International/cultural organization
5.9%
University Honors Program
5.9%
Visual/performing arts/music groups
5.8%
Political/issue groups
5.2%
Minority student groups
5.2%
Residence Hall Council, IRC
4.8%
Student Government
3.7%
Student Media/Publications
3.0%
Varsity athletic teams
2.9%
ROTC
1.8%
Union Activities Board groups
1.3%
GLBT (gay, lesbian, bisexual, transgendered) student group
1.2%
Other organization
8.0%
Total (N)
2,836
Back to Top
Back to Top
Total number of school-related groups
%
N
None
19.0%
540
One
23.8%
675
Two
20.9%
594
Three
15.2%
432
Four
9.8%
278
Five or more
11.2%
317
Total
100.0%
2,836
Back to Top
%
N
Yes
49.8%
1,142
No
50.2%
1,153
Total
100.0%
2,295
Back to Top
Leadership role in school-related organization(s)
NC State contribution to ability to effectively lead/guide others
4: Very much
3: Somewhat
2: Very little
1: Not at all
Yes
63.0%
46.1%
33.6%
28.4%
No
37.0%
53.9%
66.4%
71.6%
Total (N)
800
959
387
67
Current Behaviors
Volunteer Activities
Back to Top
Community service/service learning project has had impact on commitment in helping to improve society
How often currently volunteer for non-profit/charity/community group
Never
A few
times About once per month
Two or three times per month
Once per week or more
5: Agree
8.3%
22.6%
40.8%
40.7%
37.3%
4: Tend to agree
13.6%
27.5%
23.1%
21.8%
22.0%
3: Neither agree nor disagree
13.3%
13.5%
8.8%
10.6%
8.6%
2: Tend to disagree
2.2%
2.6%
1.6%
0.6%
1.6%
1: Disagree
4.4%
1.6%
1.1%
0.9%
2.4%
Did not complete community service/service learning project
58.1%
32.3%
24.7%
25.4%
28.2%
Total (N)
587
1,089
377
339
255
Back to Top
Preparation to being involved in public/community affairs
How often currently volunteer for non-profit/charity/community group
Never
A few
times About once per month
Two or three times per month
Once per week or more
4: Very much
12.6%
26.3%
39.6%
33.4%
35.9%
3: Somewhat
40.8%
45.4%
41.3%
41.3%
36.3%
2: Very little
32.1%
23.2%
15.5%
21.0%
19.5%
1: Not at all
14.5%
5.2%
3.6%
4.3%
8.4%
Total (N)
573
1,058
361
329
251
Physical Exercise
Back to Top
Physical ed course(s) had a positive influence on my current exercise/health habits
Current frequency of physical exercise
Once per month or less
A couple times a month
Once per week
Several times a week
Daily
5: Agree
10.7%
14.0%
19.6%
32.1%
42.4%
4: Tend to agree
12.2%
28.1%
30.5%
29.8%
25.3%
3: Neither agree nor disagree
30.5%
25.1%
24.4%
19.5%
17.4%
2: Tend to disagree
12.2%
13.6%
11.2%
8.2%
4.4%
1: Disagree
29.8%
15.3%
10.6%
7.6%
8.1%
Did not enroll in physical ed course
4.6%
3.8%
3.6%
2.8%
2.4%
Total (N)
131
235
357
1,372
545
Back to Top
Contribution of college education to developing and sustaining an active and healthy lifestyle
Current frequency of physical exercise
Once per month or less
A couple times a month
Once per week
Several times a week
Daily
4: Very much
16.3%
15.7%
22.5%
26.8%
39.3%
3: Somewhat
34.1%
51.3%
46.1%
44.3%
39.5%
2: Very little
33.3%
27.8%
25.1%
22.5%
15.2%
1: Not at all
16.3%
5.2%
6.3%
6.5%
6.1%
Total (N)
129
230
347
1,327
527
Participation in the Arts
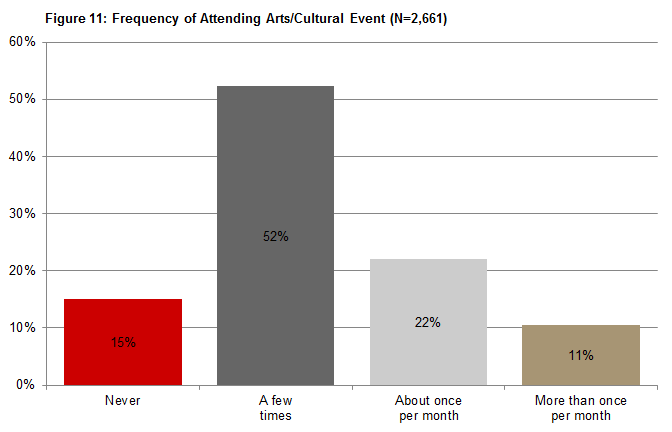
Back to Top
Attending ARTS NC State events increased my interest in attending future arts/cultural events
Currently frequency of attending arts/cultural events
Never
A few
times About once
per month More than once per month
5: Agree
3.0%
9.7%
19.1%
29.9%
4: Tend to agree
4.3%
18.8%
25.9%
24.5%
3: Neither agree nor disagree
14.1%
18.4%
17.5%
20.1%
2: Tend to disagree
4.3%
5.5%
4.0%
4.3%
1: Disagree
12.3%
4.6%
5.5%
4.3%
Did not attend ARTS event
62.1%
43.0%
28.0%
16.9%
Total (N)
398
1,386
582
278
Current Events
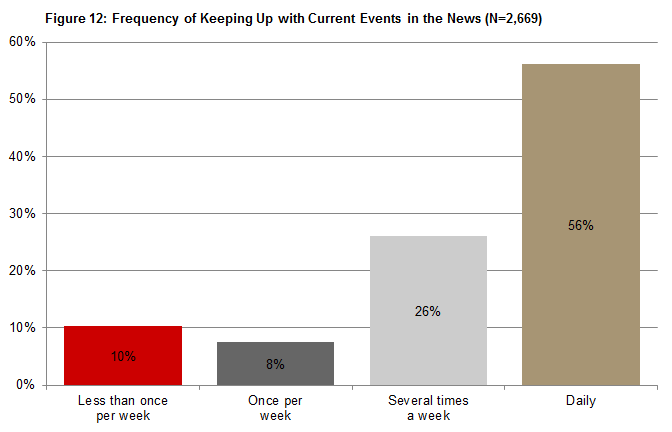
Leisure Reading
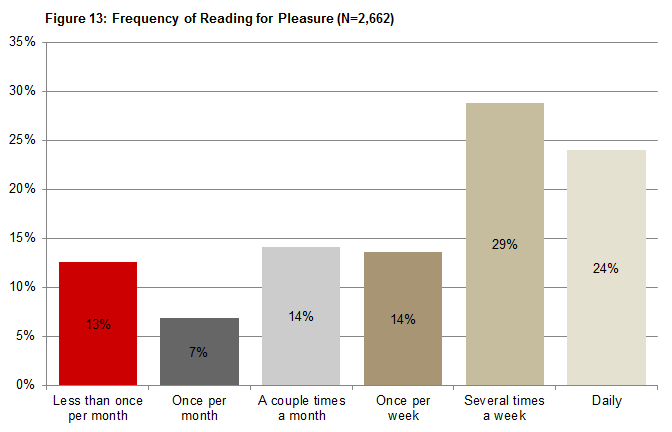
Dr. Nancy Whelchel, Associate Director for Survey Research
Office of Institutional Planning and Research
Box 7002
NCSU
Phone: (919) 515-4184
Email: Nancy_Whelchel@ncsu.edu