Table of Contents
NC State's 1997 Graduating Senior Survey asked respondents to
describe the campus climate in terms of their ratings of the discriminatory
or supportive nature of NC State's campus. This report presents
those responses.
A majority of respondents said they had never experienced discrimination
while on NC State's campus on the basis of race, gender, age,
religion, sexual orientation, physical disabilities, or other
disabilities. However, more females than males indicated that
they had experienced gender-based discrimination, and more minorities
than whites experienced race-based discrimination.
The campus climate was largely seen as supportive for all sub-groups
rated, with the most support for men and the least support for
gays and lesbians. In general, African-Americans provided the
lowest ratings of campus climate. Although comments for improving
campus climate included various kinds of discrimination, twenty-five
comments recommended improving racial relations, and ten comments
suggested improving the campus climate for women. However, ten
comments indicated a desire to de-emphasize campus diversity issues
and instead promote the well-being of all students.
Introduction and Methodology
This report presents selected information from the March 1997
survey of spring 1997 graduating seniors at NC State. The responses
analyzed represent 53.4% of the spring 1997 graduating senior
class. Results of Chi-Square tests revealed no significant differences
from the total population of graduating seniors in the areas of
gender or ethnicity at the 0.01 significance level. However, significant
differences were found by academic unit, so caution should
be used when interpreting any comparisons by academic unit because
the results may not generalize to the graduating senior class.
The quantitative data obtained from the 1997 Graduating Senior
Survey were analyzed according to standard statistical methods.
Responses were tested to determine whether there were any significant
differences according to students' gender, ethnicity, and academic
unit. Questions with categorical responses were analyzed using
Chi-Square tests, and all questions with numerically coded responses
were analyzed using either T-tests or one-way analysis of variance
(ANOVA) with Duncan's multiple comparison procedure. The significance
level for all analyses was p<0.01
In addition to the quantitative data, the respondents were also
asked two broad, open-ended questions. The first question asked,
"What are the three most important things NC State could
do to improve the quality of undergraduates' experience here?"
Of the 1,002 survey respondents, 739 (74%) answered this question.
The second open-ended question was more global: "Please share
any general comments about your experiences at NC State or tell
us why you were particularly satisfied/dissatisfied with any aspect
of your education at NC State." For this second question,
416 of the 1,002 respondents (42%) provided answers. Responses
to both open-ended questions were transcribed verbatim, and then
examined for relevant themes. To represent and illustrate themes,
student quotes are included throughout this report. Both open-ended
and forced-choice responses are discussed in conjunction with
each other.
Experiences with Discrimination
Graduating seniors were asked how often they experienced discrimination
while on NC State's campus. A four-point scale was used to rate
how frequently (never, almost never, somewhat often, very often)
respondents experienced various types of discrimination (race,
gender, age, religion, sexual orientation, physical disabilities,
and other disabilities). Because so few respondents marked "somewhat
often" and "very often," responses for these categories
were combined for this report to form a single "often"
category.
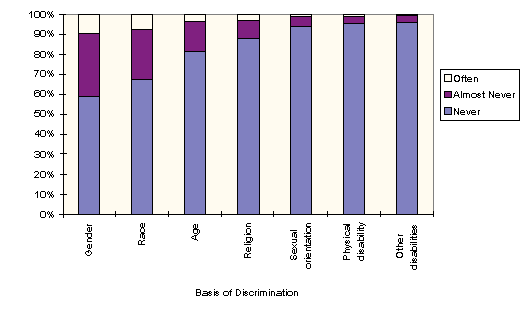
Percentages for the resulting three-point discrimination scale
(never, almost never, often) are shown in Chart 1 below. For each
type of discrimination, a majority said they had never experienced
discrimination on that basis. Nonetheless, the most common types
of discrimination were gender-based (9.6%) and race-based (7.3%).
Although discriminatory experiences were rare, Chi-Square analysis
revealed significant differences among the gender and ethnicity
of those experiencing discrimination (see Table 1). For gender-based
discrimination, some degree of discrimination (often or almost
never) was reported by 61% of female respondents, but only 26%
of male respondents. In addition, gender-based discrimination
was experienced "often" by a larger percentage of females
(14%) than males (6%).
As shown in Table 1, race-based discrimination differed significantly
by ethnic group. Some degree of race-based discrimination (often
or almost never) was reported by 86% of African-Americans and
66% of other minorities, but only 26% of whites. Similarly, respondents
indicated that race-based discrimination was experienced "often"
by 41% of African-Americans, 9% of other minorities, and 5% of
whites.
Campus Climate
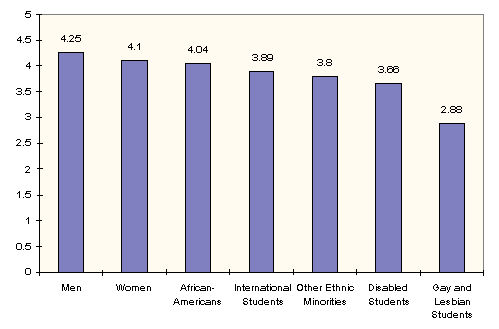
Graduating seniors were asked to assess the supportive or discriminatory
nature of campus climate using a five-point scale (strongly discriminatory=1
... strongly supportive=5). As shown in Chart 2, the campus climate
was largely seen as supportive. Respondents indicated that the
campus was most supportive for men (mean = 4.25) and least supportive
for gays and lesbians (mean = 2.88).
Some perceptions of campus climate differed significantly by gender
and ethnicity:
Discrimination and campus climate issues also appeared in responses
to the open-ended questions. One student recommended that the
university "strive towards making people comfortable about
not being a white southern male." Others suggested that NC
State "get serious about promoting diversity" and "work
to improve the campus climate." In particular, twenty-five
comments recommended improving racial relations. For gender, ten
comments suggested improving the campus climate for women.
Recommendations for improving campus climate also included other
issues: age and older students, physically disabilities, religious
affiliations, and sexual orientation. One student suggested that
NC State "add sexual orientation to the university's official
non-discrimination policy." Although comments for improving
campus climate included various subgroups, issues of race and
gender were mentioned most frequently.
The open-ended responses also indicated that not everyone was
in favor of diversity programs. One student suggested that NC
State "quit forcing diversity issues on the students."
Another stated, "It seems that academic environments such
as ours cater to minorities and women more than they cater to
students as a whole. I'm sick of diversity this and multi-cultural
that." In all, ten comments indicated a desire to de-emphasize
campus diversity issues and instead promote the well-being of
all students.
Summary