![[- NC State University -]](https://report.isa.ncsu.edu/Survey/Images/ban_logo.gif)
North Carolina State University
Spring 1998 Sophomore Survey:
Services for Students
![[- NC State University -]](https://report.isa.ncsu.edu/Survey/Images/ban_logo.gif)
North Carolina State University
Spring 1998 Sophomore Survey:
Services for Students
The University of North Carolina General Administration (UNC-GA) has developed a system of student surveys to help evaluate institutional performance. During the spring 1998 semester all sixteen UNC campuses conducted a survey of students in the middle of their undergraduate programs (currently registered �sophomores� who have completed 45-59 hours, with at least 30 at their current institution). This report examines sophomore ratings of the help available outside the classroom, safety of campus, and satisfaction with offices that serve the students, including service and staff responsiveness.
A total of 1,147 surveys (63.1% of the eligible sophomore students) were usable for this report. No significant differences by gender, ethnicity, or academic unit were found between the survey group and the population; thus, the results may be regarded as broadly representative of sophomores as defined above. Significant differences were found in answers to some questions, however, when gender, ethnicity and academic unit were considered.
Data obtained from the sophomore survey were analyzed using standard statistical methods. Responses were tested to determine whether there were significant differences when gender, baccalaureate academic units, and/or ethnicity were considered. All questions requiring categorical responses were analyzed using chi-square tests, and all questions with numerically coded responses were analyzed using either T-tests or one-way analysis of variance (ANOVA) with Duncan�s multiple comparison procedure. Tables containing details of these tests are available on the web. All significant differences by gender and ethnicity are discussed in the reports, but only select differences by academic unit are mentioned.
Summary:
SERVICES FOR STUDENTS
This report examines sophomore ratings of the help available outside the classroom, safety of campus, and satisfaction with offices that serve the students, including service and staff responsiveness.
Services Outside the Classroom
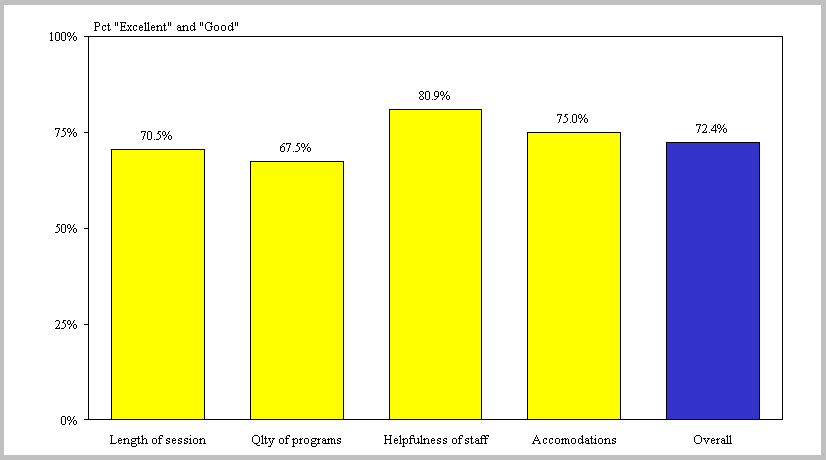
The majority of sophomores rated overall services outside the classroom either "excellent" or "good" (see Chart 1). Respondents gave their highest ratings to the overall library (mean score: 3.37 out of 4.00, see Chart 2 for greater detail) and technology services (3.26, see Chart 3 for greater detail). Students marked their least favorable scores for the overall effectiveness of orientation for new students (2.81, see Chart 7 for greater detail).
For each service, respondents could choose a "don�t know/did not use" option. The table below displays the number and percent of respondents choosing this option for the overall service items. This response is removed from analysis on all services items, as revealed in the next seven charts.
Percent Choosing the "Don�t Know / Did Not Use" Option
|
Service |
N |
% |
|
Overall skills lab/tutoring |
531 |
48.5% |
|
Overall career-related services |
260 |
23.8% |
|
Overall effectiveness of orientation |
139 |
12.7% |
|
Overall technology services |
24 |
2.1% |
|
Overall academic advising services |
19 |
1.7% |
|
Overall library services |
17 |
1.5% |
A more detailed evaluation of each service area is presented below.
Chart 1: Overall Ratings of Services Outside the Classroom

Chart 2: Library Services

Of the students who chose to comment on NCSU�s computing services, seven out of ten noted the lack of computers available for student use.
Chart 3: Technology Services

Significant differences (p<0.01) occurred across genders on several career-related services issues. Typically, female respondents gave higher marks than did males. Females rated opportunities for career assistance, resources available to explore career options, and career-services overall significantly higher than males (see Chart 5). Analysis by academic unit indicated more satisfaction with career-related services from students in the College of Agriculture and Life Sciences than from students of other colleges.
Chart 4: Career-Related Services

Chart 5: Career-Related Services by Gender

Chart 6: Academic Skill Labs/Tutoring Services

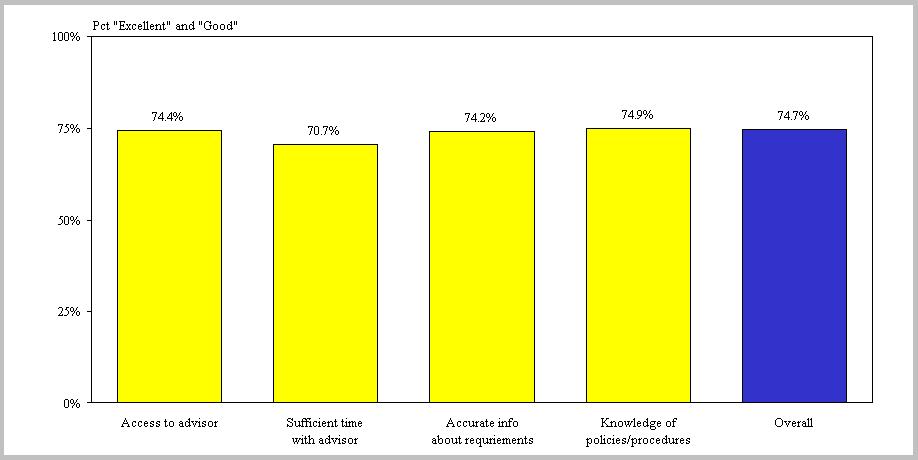
First-Year College students rated advisors� availability (access to advisor and sufficient time with advisor) and academic advising services overall significantly higher than did students in the other colleges, while students in the School of Design were less satisfied with academic advising.
Chart 7: Academic Advising

Chart 8: Orientation for New Students

Chart 9: Availability of Course Materials at Campus Bookstore

Campus Safety
Overall, 73.9% of respondents marked that the campus has taken sufficient steps to ensure their physical safety, 8.3% disagreed, and 17.8% recorded that they were unsure. When examining across genders significant differences (p<0.01) appeared for this issue. Only 66.0% of females indicated sufficient steps were taken compared to 80.7% of the males (see Chart 10). Fifteen out of the 24 open-ended responses regarding safety issues stated it is the lack of lighting on campus that needs the most improvement.
Chart 10: Campus Has Taken Sufficient Steps to Ensure Physical Safety

Non-Academic Service Areas
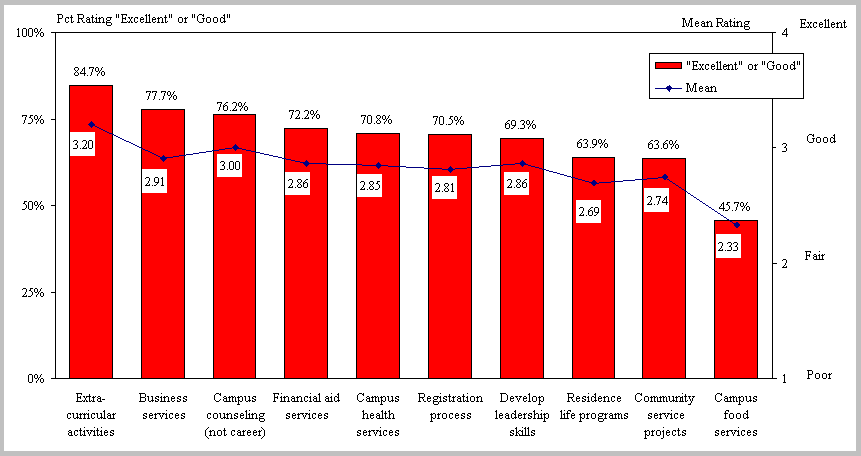
At least 60% of sophomores indicated that all but one of the non-academic service areas rated was either "good" or "excellent." Respondents rated extracurricular activities, business services/cashier/student accounts, and campus counseling (not career) services the highest. Sophomores extended their lowest ratings to campus food services (see Chart 11). Respondents were asked to rate both the service area and its staff responsiveness, and could choose a "don�t know/did not use" option. This response is removed from analysis on all items, as revealed in the following 2 charts.
Percent Choosing the "Don�t Know / Did Not Use" Option
|
Service Area |
n |
% |
|
Campus counseling (not career) services |
808 |
75.1% |
|
Opportunities to participate in community service projects |
522 |
47.8% |
|
Financial aid services |
487 |
44.6% |
|
Opportunities to develop leadership skills |
435 |
39.9% |
|
Campus residence life programs for students living in university-owned housing |
398 |
36.4% |
|
Campus health services |
373 |
34.0% |
|
Business services / cashier / student accounts |
284 |
26.3% |
|
Opportunities to participate in campus recreational and other extra-curricular activities |
274 |
24.9% |
|
Campus food services |
229 |
20.9% |
|
Registration process |
128 |
11.7% |
Of those who commented on non-academic service areas, most students revealed their discontent with campus food services. Most often noted was the quality of food at the dining facilities.
Chart 11: Evaluation of Non-Academic Service Areas

When rating the responsiveness of the non-academic service area�s staff, at least 60% of sophomores marked either "good" or "excellent" in all areas except food service (see Chart 12). Of the few students who did comment on staff responsiveness, a few alluded to dissatisfaction based on personal experiences.
Chart 12: Evaluation of Non-Academic Services� Staff Responsiveness

 Tables by Gender/Ethnicity
 Tables by Academic Unit