![[- NC State University -]](https://report.isa.ncsu.edu/Survey/Images/ban_logo.gif)
Spring 1998 Sophomore Survey: An Overview
Table of Contents
- Introduction
- Summary
- Demographics of Sophomore Survey Respondents
- Profile Information
- Faculty Contributions and Academic Environment
- Services for Students
- Knowledge, Skills, and Personal Development
Return to OIRP Survey Page
Return to OIRP Home Page
Office of Institutional Planning and Research, June 1998
Philip Handwerk, Graduate Research Assistant
Denise Gardner, Coordinator of Survey Research
Introduction
The University of North Carolina General Administration (UNC-GA)
has developed a system of student surveys to help evaluate institutional
performance. During the spring 1998 semester all sixteen UNC
campuses conducted a survey of students in the middle of their
undergraduate programs (currently registered 'sophomores' who
have completed 45-59 hours, with at least 30 at their current
institution). This reports represents an initial university-level
overview of the results for NC State.
No significant differences by gender, ethnicity, or academic
unit were found between NC State's survey group and its broader
population of students; thus, the results may be regarded as representative
of the sophomore class as defined by UNC-GA. This report presents
information regarding the demographics, profile, assessment of
faculty contributions, academic environment, and knowledge development
of sophomore students at NC State in the Spring of 1998.
Summary
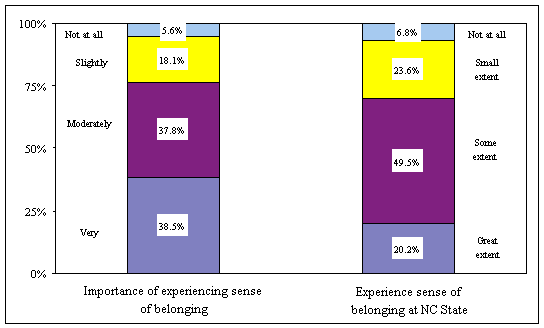
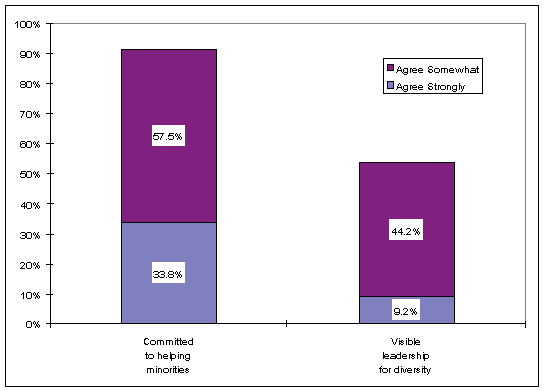
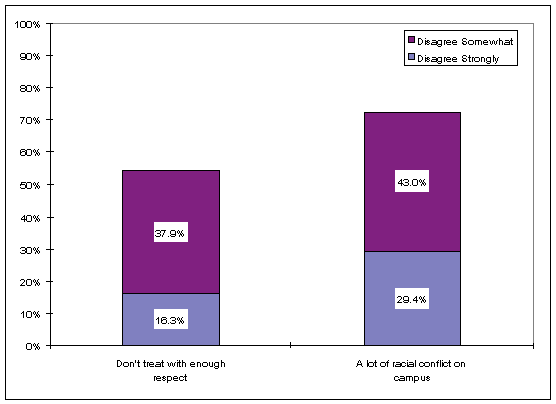
Sense of Belonging or Community at NC State Commitment to Minority Success and Diversity
Leadership
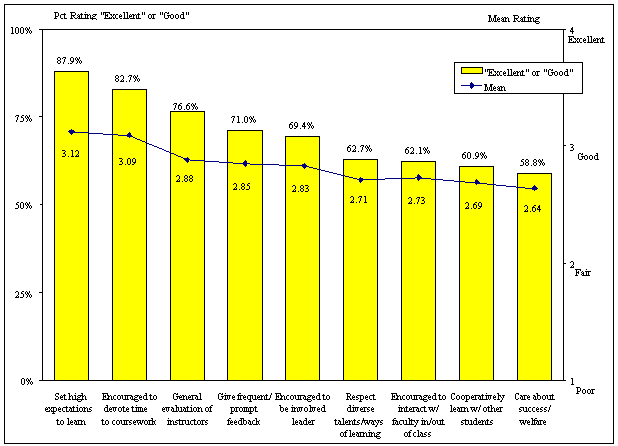
This section presents respondents' evaluations of faculty in
nine areas, and their overall evaluations of the learning environment
at NC State.
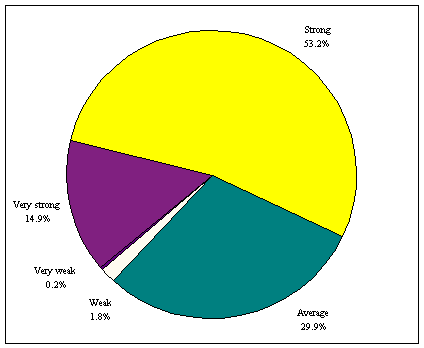
Overall Intellectual Environment
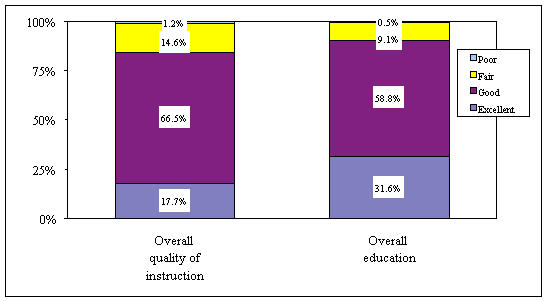
Overall Evaluation of Quality of Instruction
and Education Receiving
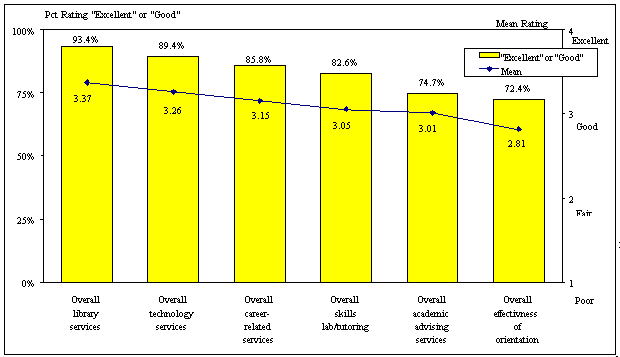
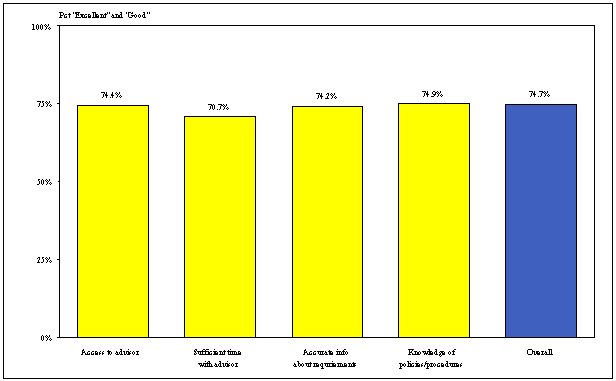
This sections examines sophomore ratings of the help available
outside the classroom, safety of the campus, and satisfaction
with offices that serve students (including service and staff
responsiveness). For each service, respondents could choose a
"don't know/did not use" option. The table below displays
the number and percent of respondents choosing this option for
the overall service items. This response is removed from analysis
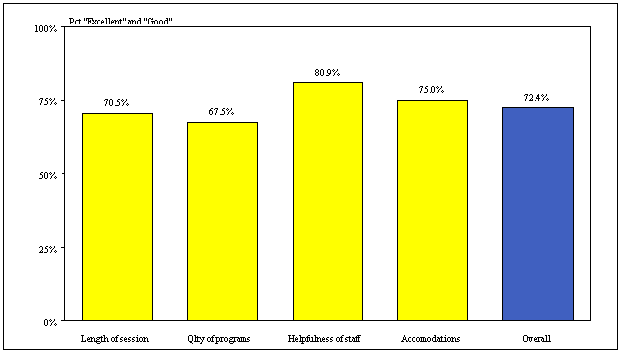
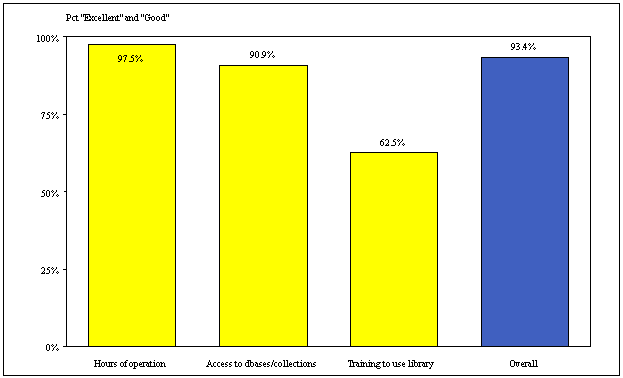
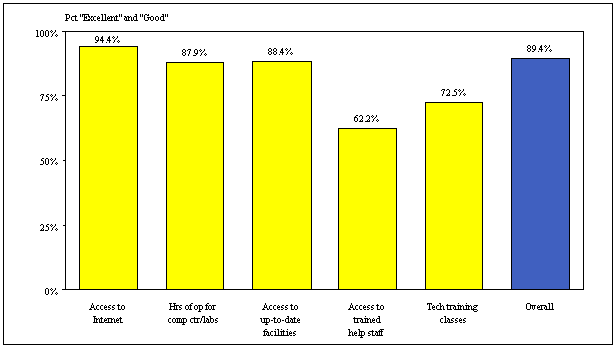
on all services items, as revealed in the next seven charts.
Orientation for New Students
Academic Advising
Academic Skill Labs/Tutoring Services
Library Services
Technology Services
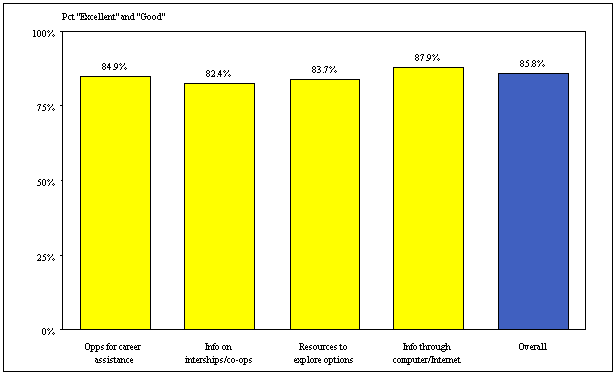
Career-Related Services
Availability of Course Materials at Campus
Bookstore
Campus Has Taken Sufficient Steps to Ensure
Physical Safety
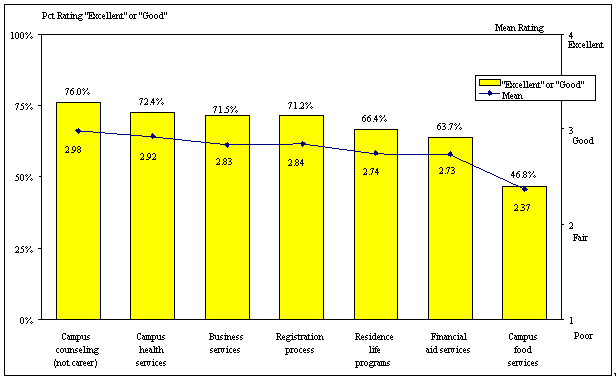
Non-academic
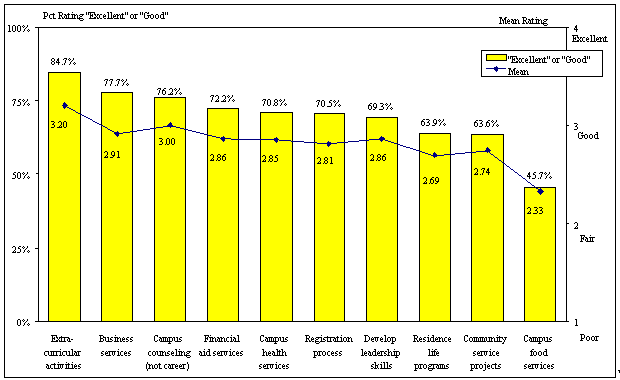
service areas were also evaluated. Respondents
were asked to rate both the service area and its staff responsiveness,
and could choose a "don't know/did not use" option.
The table below displays the number and percent of respondents
choosing this option. This response is removed from analysis
on all items, as revealed in the following two charts.
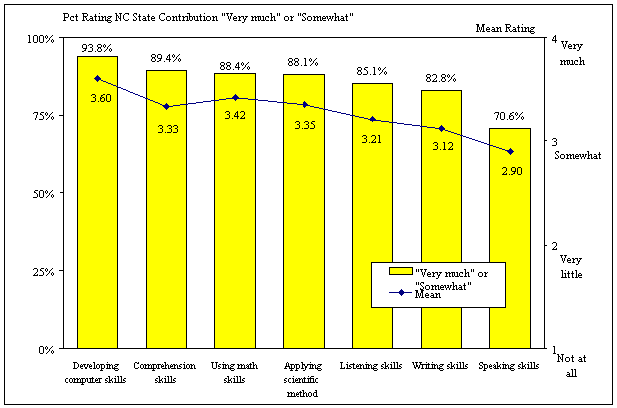
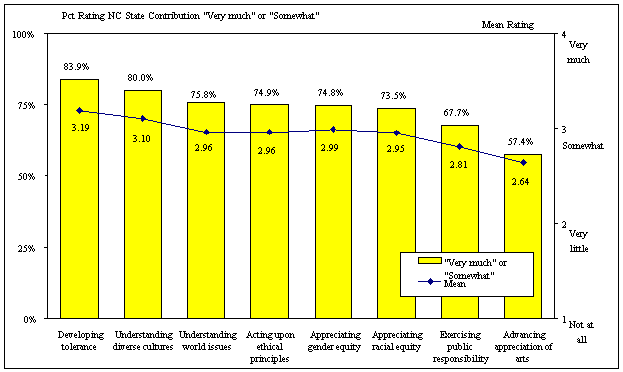
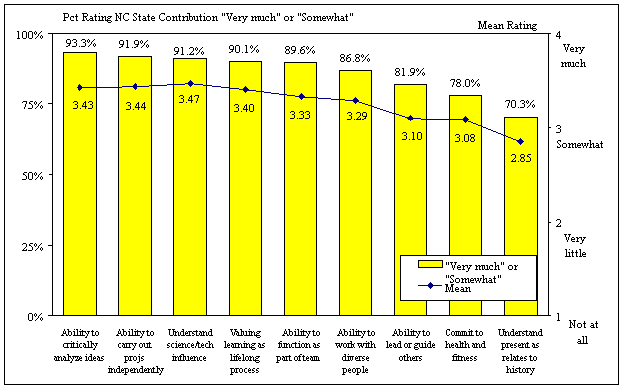
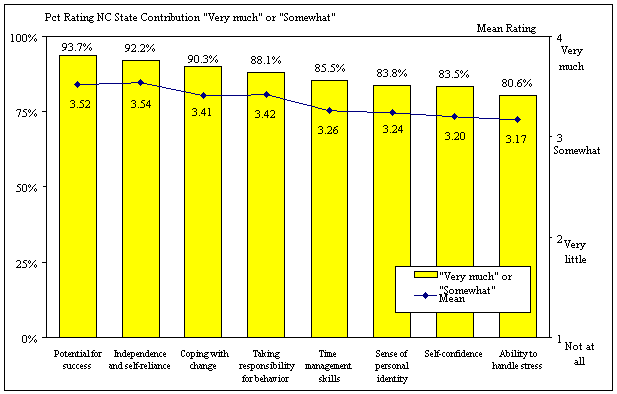
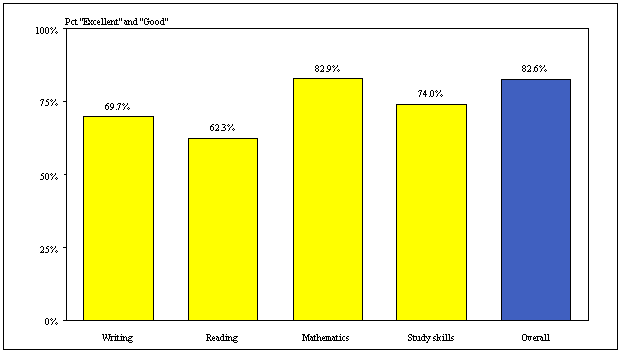
Sophomore students rated the extent NC State had contributed
to their knowledge, skills and personal development on a set of
goals held by NC State for undergraduate preparation. Respondents
rated the contribution using a four-point scale, from "not
at all" to "very much", and could also choose a
"don't know" options. Only four items had more than
4% "don't know" response: appreciating racial equity
(4.9%), appreciating gender equity (5.2%), exercising public responsibility
and community service (5.2%), and recognizing and acting upon
ethical principles (5.3%). Results, excluding the "don't
know" responses, are presented in four areas: technical
skills, attitudes and values, established goals for undergraduate
education, and personal development.
No significant differences by gender,
ethnicity, or academic unit were found between NC State's survey
group and its broader population of students; thus, the results
may be regarded as representative of the sophomore class as defined
by UNC-GA (currently registered 'sophomores' who have completed
45-59 hours, with at least 30 at their current institution).
African-American
Asian
Hispanic
Native American
White
Total
Agriculture and Life Sciences (Bachelor's)
371 20.4
264 23.0
Design 63
3.5 48
4.2 Education and Psychology
80 4.4
45 3.9
Engineering 496
27.3 345
30.1 First Year College
123 6.8
63 5.5
Forest Resources 67
3.7 40
3.5 Humanities and Social Sciences
227 12.5
126 11.0
Management 244
13.4 126
11.0 Physical and Mathematical Sciences
59 3.2
36 3.1
Textiles 87
4.8 54
4.7
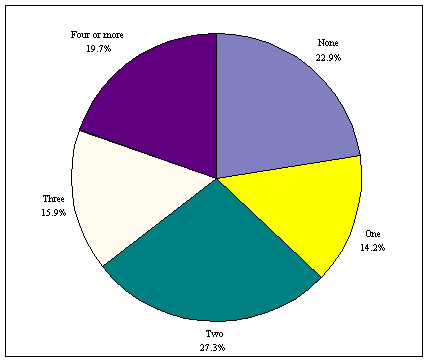
Number of Classes
Too Large to Learn Effectively
Number of Classes in Which Student Had Difficulty
Understanding Spoken English of Instructor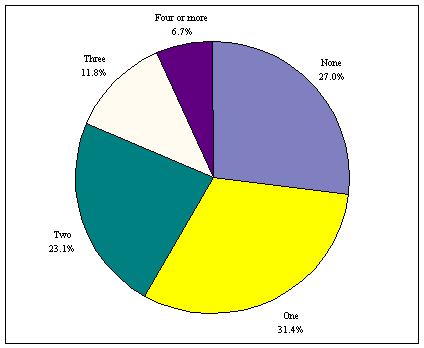
Service Overall skills lab/tutoring
531 48.5%
Overall career-related services
260 23.8%
Overall effectiveness of orientation
139 12.7%
Overall technology services
24 2.1%
Overall academic advising services
19 1.7%
Overall library services
17 1.5%
Service Area Campus counseling (not career) services
808 75.1%
Opportunities to participate in community service projects
522 47.8%
Financial aid services
487 44.6%
Opportunities to develop leadership skills
435 39.9%
Campus residence life programs for students living in university-owned housing
398 36.4%
Campus health services
373 34.0%
Business services / cashier / student accounts
284 26.3%
Opportunities to participate in campus recreational and other extra-curricular activities
274
24.9%
Campus food services
229 20.9%
Registration process
128 11.7%

