Return to OIRP Survey Page
Return to OIRP Home Page
Overview
This report presents a profile of entering 1996 First-Year students at NC State. It is based on responses to a survey that is given each year during summer orientation sessions, and represents 88.0% of the 1996 First-Year class. The report includes students entering into all 11 undergraduate academic units, including the Agricultural Institute and the First Year College. No significant differences were found between the demographic characteristics of the sample and the broader population of entering First-Year students when gender, ethnicity and academic unit were considered. The results obtained from the survey, therefore, may be regarded as broadly representative of the 1996 class. Significant differences were found for many of the answers to questions, however, when gender, ethnicity and academic units were considered.
The 1996 First-Year class differed somewhat from the 1995 entering class. The percentage of females declined from 42.1% in 1995 to 40.1% in 1996. The percentage of African-Americans declined from 12.8% in 1995 to 11.2% in 1996. SAT Total scores remained constant from 1995 to 1996; the High School Grade Point Averages increased from 3.56 in 1995 to 3.65 in 1996; and the Academic Index declined from 2.93 in 1995 to 2.77 in 1996.
Factors that most strongly influenced this year's new students to attend NC State included academic reputation, availability of program, facilities and resources available, and level of support for intended major. Almost one-third of new students reported that they will receive need-based financial aid, and about two-thirds said they did not plan to work during their first academic semester.
In general, female and African-American respondents rated most of the undergraduate education goals set by NC State as higher in importance than did their comparison groups.
Office of Institutional Planning and Research would like to thank the Office
of New Student Orientation and First Year Experience, and especially
Dr. Roger Callanan, for assistance with the administration of
the survey.
Market Research
Educational Intent
Goals for Undergraduate Preparation
From a list of knowledge, skills, and personal development goals
set by NC State, First-Year students were asked to indicate their
current level of development and the importance they placed on
each goal at the time of the survey. The goals fell into three
areas: general education, personal development and world view.
of development in these areas revealed several interesting findings.
Consistency of high importance and high level of development
was found in the goals of taking responsibility for
my own behavior and viewing learning as a lifelong process.
The greatest gap between importance and level of development
was found in managing my time.
Student Affairs Programs and Activities
Financial Aid
Parent/Guardian Education
Employment During First Academic Semester
Return to Table of Contents
Return to OIRP Survey Page
Purpose
This report presents a profile of 1996 entering First-Year students
at NC State. As in previous studies, it is based on responses
to a survey that is given during the summer orientation sessions.
The report looks at responses from students entering into all
undergraduate programs in the fall of 1996. These programs include
the two-year Agricultural Institute and the First Year College.
Description of Sample
A total of 3,310 First-Year students attended these orientation
sessions. Of this total, 3,216 surveys, which represent 88.0%
of the 3,656 First-Year students who registered for the fall 1996
semester, were usable for this report. Tests of statistical significance
revealed no significant differences between the survey group and
the broader population of registered students (gender, Chi-sq.
0.0104, df=1, p>0.01; ethnicity, Chi-sq. 0.0269, df=2,
p>0.01; academic unit Chi-sq. 0.7465, df=10. p>0.01).
Thus, the results obtained from analysis of the responses may
be regarded as broadly representative of the entire group of
entering First-Year students. Significant differences were found
in answers to some questions, however, when gender, ethnicity
and academic unit were considered.
Methodology
The data obtained from the First-Year orientation sessions were analyzed using standard statistical methods. Responses were tested to determine whether there were significant differences when gender or ethnicity were considered. Selected items were also analyzed for significance by academic unit.
All questions requiring categorical responses (questions 1, 3-16, 18-30) were analyzed using Chi-Square tests, and all questions with numerically coded responses (questions 2 and 17) were analyzed using either T-tests or one-way analysis of variance (ANOVA) with Duncan's multiple comparison procedure.
In tests of statistical significance, p values of 0.01 or less were considered to indicate significant differences. For tests that report an exact p-value (Chi-Square, T-test), the exact p-values are specified in discussions preceding tables when practical. Duncan's procedure does not report an exact p-value, so in this case it is reported as less than or equal to the specified significance level of the test (in this case, alpha = 0.01). To make identification of significant results easier, the category of significant responses as well as an approximate p-value (p < 0.01) appears below the corresponding table.
Outline of Report
Section I Demographics of the First-Year Class and Survey Respondents
Presents overall demographic profiles of the 1996 First-Year
class and survey respondents.
Section II Marketing Research
Presents information about First-Year students' experiences
with the application process and those factors found to influence their
decision to attend NC State (questions 1-5).
Section III Educational Intent and Interests
Reports responses to several questions about educational intent
and interests (questions 6-11, question 18)
Section IV General Education Goals
Provides ratings of current level of development and importance
at the time of the survey of twelve goals for general education specified by
NC State (question 17).
Section V Personal Development Goals
Provides ratings of current level of development and importance
of sixteen goals related to student personal development at
the time of the survey (question 17).
Section VI World View Goals
Provides ratings of current level of development and importance
of seven goals related to student world view at the time of
the survey (question 17).
Section VII Co-curricular Interests
Present responses to questions dealing with interest in co-curricular
programs and activities (questions 12-16).
Section VIII Background Information
Reports background information on areas such as financial aid
received, households, employment plans, and other personal information
(questions 19-30).
Section IX Academic Unit Analysis
This section provides responses to selected questions for First-Year students enrolled in each of NC State's college and schools.
Return to Table of Contents
Return to OIRP Survey Page
This section presents select demographics for the 1996 First-Year
class and for survey respondents. These categories include gender,
ethnicity, and enrollment in academic unit.
The First-Year class of 1996 numbered 3,535 four-year enrollees plus 121 enrollees in the Agricultural Institute (two-year program) for a total of 3,656 fall enrollees. Of this group, 25 were international students of which four completed the survey. Two of the international students who completed the survey classified themselves as Other Minorities, one as African-American and one as White.
The total number of usable surveys from the orientation sessions was 3,216. Demographics by gender and ethnic group are found in Table 1.
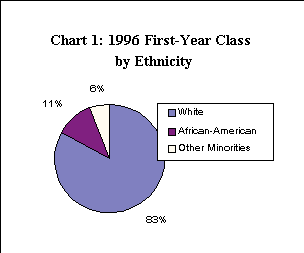
The breakdown of the First-Year class by gender was: 40.1% female
and 59.9% male; and by ethnicity: 82.8% White, 11.2% African-American,
and 6.1% Other Minorities.
| African-American | ||||||
| Asian | ||||||
| Hispanic | ||||||
| Native American | ||||||
| White | ||||||
| Total | ||||||
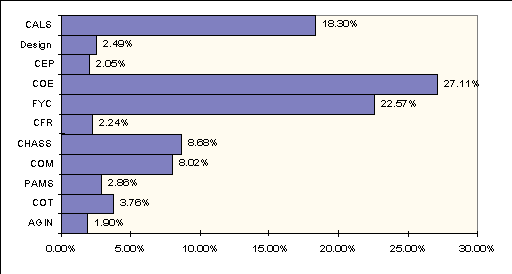
Table 2 presents enrollment of First-Year students as well as
survey respondents by academic unit. The eleven units of the
university are: College of Agriculture and Life Sciences - Bachelor's
(CALS), Agricultural Institute - Two-Year (AGIN), School of Design
(Design), College of Education and Psychology (CEP), College of
Engineering (COE), First Year College (FYC), College of Forest
Resources (CFR), College of Humanities and Social Sciences (CHASS),
College of Management (COM), College of Physical and Mathematical
Science (PAMS), and College of Textiles (COT). The College of
Agriculture and Life Sciences is divided into those students in
the Bachelor's program and those in the Agricultural Institute
(Two-Year). The largest percentage of First-Year students enrolled
in the College of Engineering (25.9%) and First Year College (23.0%).
The smallest percentage of First-Year students enrolled in the
College of Education and Psychology (2.2%) and School of Design
(2.3%).
| Agriculture and Life Sciences (Bachelor's) | ||||
| Design | ||||
| Education and Psychology | ||||
| Engineering | ||||
| First Year College | ||||
| Forest Resources | ||||
| Humanities and Social Sciences | ||||
| Management | ||||
| Physical and Mathematical Sciences | ||||
| Textiles | ||||
| Subtotal | ||||
| Agricultural Institute (Two-Year) | ||||
| Total | ||||
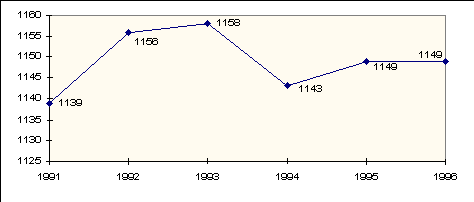
Statistics for Fall 1996 First-Year bachelor's degree students
are shown in Table 3. The mean total SAT for all students was
1,149, which is comparable to the 1995 First-Year mean of 1,149
(adjusted). Highest mean scores for SAT Total scores were found
for students enrolled in the College of Engineering and the School
of Design. Design students registered the highest Admissions
Index (AI) and High School Grade Point Average (HSGPA). It should
be noted that in 1996 the Educational Testing Services, which
administers the SAT, adjusted and recentered scores of the math
and verbal portions of the test to establish a national mean of
500 for each area. In 1995, the mean Total SAT for First-Year
students was 1,069, using the original scale. This equates to
1,149 on the new scale and is comparable to the 1996 Total score.
|
|
|
|
|
|
| |
| Agriculture and Life Sciences (Bachelor's) | ||||||
Design | ||||||
Education and Psychology | ||||||
Engineering | ||||||
First Year College | ||||||
Forest Resources | ||||||
| Humanities and Social Sciences | ||||||
Management | ||||||
| Physical and Mathematical Sciences | ||||||
Textiles | ||||||
| Overall |
From 1993 through 1995 the overall HSGPA remained fairly steady
at 3.53 in 1993, 3.51 in 1994, and 3.56 in 1995. In 1996 the
HSGPA increased to 3.65. During this period, however, the overall
AI decreased from 2.93 in 1995 to 2.77 in 1996. A mixed trend
exists over the past six years for SAT Total scores (see Chart
3). The mean for SAT Total scores for 1995 and 1996 remained
unchanged at 1,149.
Return to Table of Contents
Return to OIRP Survey Page
This section presents information about the experiences First-Year
students had with the application process. It also looks at those
factors students considered influential in their decision to attend
NC State.
Applications
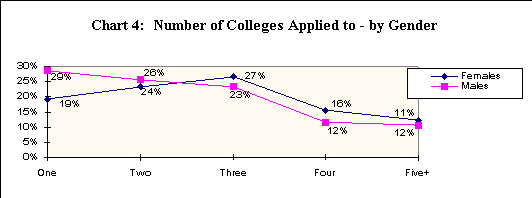
One-fourth of survey respondents indicated that they applied only to NC State (see Table 4). Another one-fourth applied to only one other school in addition to NC State. Significant differences (p=0.001) were found when both gender and ethnicity were considered. A larger percentage of males (29%) than females (19%) applied only to NC State (see Chart 4). When ethnicity was considered, a larger percentage of Other Minorities (21%) applied to five or more schools, including NC State, than did those in the other two groups (12% White; 15% African-American).
A comparison of academic units also revealed significant differences
(p =0.001). Larger percentages of First-Year students in Engineering
(37%), Forest Resources (30%) and the Agriculture Institute (73%)
applied only to NC State than those enrolled in the other colleges/schools.
Only 14% of those enrolled in both the Colleges of Education/Psychology
and Humanities and Social Sciences indicated they applied only
to NC State.
| Number colleges applied to this year (%) |
| |||||
| One | ||||||
| Two | ||||||
| Three | ||||||
| Four | ||||||
| Five or more |
Factors Influencing Attendance Decision
First-Year students were asked to indicate the extent that any of seventeen factors influenced their decision to attend NC State. The scale used was: 5 = Very Strong Influence, 4 = Strong Influence, 3 = Moderate Influence, 2 = Weak Influence, and 1 = Very Weak Influence. Table 5 lists the means and standard deviations calculated for each factor, ranking them from highest to lowest.
First-Year students indicated that academic reputation had the strongest influence (5 = Very Strong Influence; 4 = Strong Influence) on their decision to attend NC State. Other strong influences were: availability of program, facilities and resources available and support for my intended major. There were no significant differences between males and females for these three items. There were significant differences when gender was considered for seven factors. Females rated these factors significantly more important than did males: location, contact with a current student, campus visit prior to orientation, size, scholarships/financial aid available, publications from NC State and attendance at a College Fair.
Many factors were rated significantly different (p < 0.01) by the three ethnic groups. African-American respondents rated academic reputation, availability of program, support for intended major, contact with a school official, attendance at a College Fair, publications from NC State and extracurricular opportunities as significantly stronger (p < 0.01) factors in their decision to attend NC State than did Whites and Other Minorities.
African-Americans also believed that location was a significantly stronger (p < 0.01) factor than did Other Minorities and they believed that size was a significantly (p < 0.01) stronger factor than did Whites. African Americans also rated facilities and resources available and campus visit prior to orientation as stronger factors than did both Whites and Other Minorities, although Whites rated these two categories as significantly stronger factors than did Other Minorities (p < 0.01). Other Minorities considered cost a more significant factor in their decision than did both Whites and African-Americans (p < 0.01).
Respondents were allowed to list "other" factors that influenced their decision to attend NC State. The overall mean for this item was 4.43 (SD - 1.04), which gave this item the highest mean score of all 17 factor choices. There were, however, no significant differences when gender and ethnicity were considered. Factors that respondents frequently listed in the "other" category varied but included: the Naval ROTC program, study abroad, diversity of the university (both courses and people), rejection from other colleges, the co-op programs and athletics.
Significant differences (p < 0.01) were found for most factors when academic units were compared. Exceptions in which no significant differences among academic units were found included number of hours transferred/credited, publications from NC State, and attendance at a College Fair (see Table 6).
The four factors having the strongest influence, based on highest reported means for students in the academic units were:
Academic reputation: Engineering, Physical and Mathematical Sciences Forest Resources and Textiles; Availability of program: Design, Agricultural Institute, Forest Resources and Engineering; Facilities and resources: Design, Textiles, Forest Resources and Engineering; Level of support for intended major: Design, Engineering, Physical and Mathematical Sciences, and Textiles.
Factors survey respondents considered less important in their
decision to attend NC State (having moderate [3] or less influence
[2,1]) included: size, extracurricular opportunities, scholarship/financial
aid available, contact with a school official, publications from
NC State, number of hours transferred or credited and attendance
at a College Fair.
| Mean and standard deviation | |||||||
| Other | |||||||
| Academic reputation | |||||||
| Availability of program | |||||||
| Facilities and resources available | |||||||
| Support for intended major | |||||||
| Location | |||||||
| Cost | |||||||
| Recommended | |||||||
| Contact with a current student | |||||||
| Campus visit prior to orientation | |||||||
| Size | |||||||
| Extracurricular opportunities | |||||||
| Scholarships/financial aid available | |||||||
| Contact with a school official |
| ||||||
| Publications from NC State | |||||||
| Number hours transferred/credited | |||||||
| Attendance at a College Fair | |||||||
| Mean and Standard Deviation | |||||||
| Academic reputation* | |||||||
| Availability of program* | |||||||
| Facilities and resources available* | |||||||
| Level of support for intended major* | |||||||
| Location* | |||||||
| Cost* | |||||||
| Recommended by friend, family member, teacher, etc.* | |||||||
| Contact with a current student* | |||||||
| Campus visit prior to orientation* | |||||||
| Size* | |||||||
| Extracurricular opportunities* | |||||||
| Scholarships/financial aid available* | |||||||
| Contact with a school official* | |||||||
| Publications from NC State | |||||||
| Number of hours transferred/credited | |||||||
| Attendance at a College Fair | |||||||
| Mean and Standard Deviation | ||||||
| Academic reputation* | ||||||
| Availability of program* | ||||||
| Facilities and resources available* | ||||||
| Level of support for intended major* | ||||||
| Location* | ||||||
| Cost* | ||||||
| Recommended by friend, family member, teacher, etc.* |
| |||||
| Contact with a current student* | ||||||
| Campus visit prior to orientation* | ||||||
| Size* | ||||||
| Extracurricular opportunities* | ||||||
| Scholarships/financial aid available* | ||||||
| Contact with a school official* | ||||||
| Publications from NC State | ||||||
| Number of hours transferred/credited | ||||||
| Attendance at a College Fair | ||||||
After rating the importance of factors that affected their decision to attend NC State, First-Year students were asked to pick the single-most influential factor in their decision. Table 7 lists the importance of factors, according to decreasing percentage order.
The highest percentage of all students chose academic reputation (22%) as the single most important factor in their decision to attend NC State followed by availability of program (17%) and level of support for my intended major (15%).
Significant differences were found between males and females (p < 0.002) as well as among ethnic groups (p < 0.01). For the most important factors, females indicated more strongly than did males that the most influential factors in their decision to attend NC State were level of support for intended major, location, and the availability of scholarships and financial aid. Factors males indicated more strongly than did females in their decision were academic reputation, availability of program, cost, and facilities and resources available.
Among ethnic groups, African-Americans indicated more strongly
than did Whites and Other Minorities that these factors influenced
their decision: Academic reputation and availability
of financial aid and scholarships. Whites indicated more
strongly than African-Americans and Other Minorities that availability
of program, level of support for intended major, and location
were the most influential factors. Other Minorities indicated
more strongly than African-Americans and Whites that cost
was the most influential factor in their decision.
Most influential factor (%) | |||||||
| Academic reputation | |||||||
| Availability of program | |||||||
| Level of support for major | |||||||
| Location | |||||||
| Cost | |||||||
| Recommended by friend, family, teacher, etc. |
| ||||||
| Facilities, resources available | |||||||
| Scholarships/financial aid | |||||||
| Campus visit | |||||||
| Other | |||||||
| Contact with current student | |||||||
| Extracurricular opportunities | |||||||
| Size | |||||||
| Contact with a school official | |||||||
| Publications from NC State | |||||||
| Number of hours transferred/credited |
|
|
|
|
|
| |
| Attendance at a College Fair | |||||||
Two Most-Important Factors by Academic Unit
Table 8 presents the percentage of the two most-influential factors chosen by respondents in each academic unit. Academic reputation was listed as one of the top two influential factors for students in nine of the eleven colleges/schools in their decision to attend NC State. Academic reputation was not listed as either the first or second-most influential factors by students in only the College of Agriculture and Life Sciences and the School of Design. A test for significant differences was not possible because some response categories had too few respondents.
| Single most influential factor (%) | |||||||
| Academic reputation | |||||||
| Availability of program | |||||||
| Level of support for my intended major |
| ||||||
| Location | |||||||
| Scholarship/financial aid available |
| Single most influential factor (%) | ||||||
| Academic reputation | ||||||
| Availability of program | ||||||
| Level of support for my intended major |
| |||||
| Location | ||||||
| Scholarship/financial aid available |
|
Contact After Applying to NC State
First-Year students were asked whether they received phone calls from NC State representatives after applying for admission. Table 9 shows the results. Overall, 21% of all students reported receiving a call from a faculty or staff member, 16% from a current student and 8% from a graduate. When ethnicity was considered, significant differences (p=0.001) were found only in the item concerning whether a student received a call from a faculty/staff member. Among African-Americans, 34% received a call from either a faculty or staff member compared to 22% of Other Minorities and 20% of Whites.
In all, 59% of African-Americans received either a call from a faculty/staff member, a current student or a graduate after applying. That percentage compares to 44% of Whites and 41% of Other Minorities.
Of those who received a phone call, 64% reported that personal
contact was a positive factor in their decision to enroll at NC
State (see Table 10). There was not a significant difference for
responses when gender or ethnicity was considered.
| Received call from after applying (%) | ||||||
| Faculty/Staff member ++ | ||||||
| Current Student | ||||||
| Graduate |
| Personal contact of phone call a positive factor in decision to enroll (%) | Male | |||||
| Yes | ||||||
| No | ||||||
| Not sure |
When academic units were compared, significant differences (p
< 0.01) were found for students who reported they received
calls after applying for admission in these two areas: call from
faculty or staff member and call from a current student. There
were no significant differences in responses to the item concerning
whether students had received a call from a graduate. Eighty-four
percent of Physical and Mathematical Sciences students and 40%
of students in Forest Resources and in Management received calls
from either a faculty or staff member. In the other academic
units, however, less than 32% of students reported receiving such
a call. The highest percentage of students receiving a call from
a current student were found in Forest Resources (28%) and Physical
and Mathematical Sciences (23%). Only 11% of students in Design
received such a call.
Return to Table of Contents
Return to OIRP Survey Page
This section reports responses to several survey questions that
asked about educational intent and interests of First-Year students.
College Major
Seventy percent of new First-Year students reported being certain or very certain of their choice of a college major (see Table 11). Significant differences were found when both gender (p=0.002) and ethnicity (p=0.001) were considered. A larger percentage of females (32%) than males (30%) said they were either very uncertain or uncertain about their college major. When ethnicity was considered, a larger percentage of Other Minorities (33%) and Whites (32%) said they were either very uncertain or uncertain of their college major compared to African-Americans (18%).
| Certainty of college major (%) | ||||||
| Very uncertain | ||||||
| Uncertain | ||||||
| Certain | ||||||
| Very certain |
Intent
As Table 12 shows, a majority of First-Year students said that their primary goal or objective for attending NC State is either to obtain a bachelor's degree as preparation for further schooling (56%) or to obtain a bachelor's degree as preparation for career (31%). Significant differences (p=0.001) were found when both gender and ethnicity were considered. More females (66%) said they are preparing for further schooling than did males (49%) while more Whites (8%) than Other Minorities (7%) and African-Americans (3%) indicated they plan to pursue a bachelor's degree or certificate only.
| Primary goal for attending NC State (%) | ||||||
| Bachelor's degree or certificate only |
|
|
|
|
| |
| Bachelor's degree as preparation for school |
|
|
|
|
|
|
| Bachelor's degree as preparation for career |
|
|
|
|
|
|
| Improvement for current profession |
|
|
|
|
|
|
| Courses for personal interest |
|
|
|
|
|
|
| Other |
Educational Aspirations
The data in Table 13 reveal that 26% of survey respondents plan to stop their education after they complete a bachelor's degree, while 42% plan to go on and complete a master's degree. A significant difference (p=0.001) was found when gender was considered, with more males (29%) than females (20%) planning to stop when they complete a bachelor's degree. Of those planning to continue on for a doctoral or other professional degree, 39% were female and 25% were males.
Significant differences (p=0.001) also were found when ethnicity
was considered: 42% of Other Minorities planned to continue on
for a doctoral or other professional degree compared to 40% of
African-Americans and 29% of Whites.
| Highest level of education planned (%) | Male | |||||
| Certificate | ||||||
| Bachelor's degree | ||||||
| Master's degree | ||||||
| Doctoral degree | ||||||
| Doctor of Veterinary Medicine |
|
|
|
|
|
|
| Other professional degree |
|
|
|
|
|
|
| Do not intend to complete a degree |
|
|
|
|
|
|
Time to Degree Completion
Of the First-Year students, 76% said they plan to complete their
bachelor's degree in four years or less and 12% said they plan
to take five years (see Table 14). Significant differences were
found for both gender (p=0.001) and ethnicity (p=0.007). More
females (85%) than males (70%) plan to take only four years or
less to complete their schooling, while more males (26%) than
females (13%) plan to take between four and five years. More
African-Americans (27%) than Whites (20%) and Other Minorities
(21%) plan to take between four and five years to complete their
degree.
| Length of time to complete bachelor's degree (%) |
|
|
|
|
|
|
| Less than 4 years | ||||||
| 4 years | ||||||
| 4 1/2 years | ||||||
| 5 years | ||||||
| 5 1/2 years | ||||||
| 6 or more years | ||||||
| Will not complete bachelor's degree |
|
|
|
|
|
|
Enrollment
Tables 15 and 16 show the responses of First-Year students to two questions concerning their enrollment plans. Overall 85% of students said that they would take 15 or more hours of classes during their first semester. Significant differences (p < 0.001) were found when ethnicity was considered. More African-Americans (30%) than Whites (13%) or Other Minorities (14%) plan to enroll for 12 to 14 credit hours of classes.
Only 11% of respondents plan to take the majority of their courses in late afternoon and evening. There were no significant differences when gender and ethnicity were considered.
| First semester enrollment status (%) | ||||||
| 15 credit hours of classes or more |
|
|
|
|
|
|
| 12-14 credit hours of classes |
|
|
|
|
|
|
| Less than 12 credit hours of classes |
|
|
|
|
|
|
| Courses in afternoon/evening (%) |
| |||||
| Yes | ||||||
| No |
Foreign Language
First-Year students were asked whether they planned to study
a foreign language beyond the minimum requirements set for their
major and, if so, which language they would pursue. The data
in Table 17 reveal that of those who plan to continue language
study 59% intend to take Spanish. An additional 19% said they
plan to continue with French. Significant differences (p=0.001)
were found when gender and ethnicity were considered. A larger
percentage of females (81%) said they will study either Spanish
or French than did males (75%). When ethnicity was considered,
a larger percentage of African-Americans (86%) said they plan
to take either Spanish or French than did Whites (78%) and Other
Minorities (59%). A larger percentage of Other Minorities, however,
indicated they will study either Japanese or Chinese (22%) than
did African-Americans (9%) or Whites (6%).
| Foreign language will study beyond minimum major requirement (%) | ||||||
| Spanish | ||||||
| French | ||||||
| German | ||||||
| Japanese | ||||||
| Chinese | ||||||
| Russian | ||||||
| Other |
Return to Table of Contents
Return to OIRP Survey Page
This section provides First-Year students' ratings of twelve
goals for general education as specified by NC State. Respondents
were asked their current level of development toward these goals
as well as the importance they placed on each goal at the time
of the survey.
Level of Development
The means and their standard deviations for level of development of general education goals, ranked from highest to lowest for the total group, appear in Table 18. The rating scale used was: 5 = Very High, 4 = High, 3 = Average, 2 = Low, and 1 = Very Low. The four general education goals in which First-Year students indicated their highest current level of development were: acquiring a broad general education, ability to plan and carry out projects independently, developing good listening skills, and ability to apply mathematics skills.
Significant differences (p < 0.01) were found for several goals when gender was considered. Males rated their development significantly higher than did females in their ability to apply mathematics skill, to understand how science and technology influence everyday life, in their ability to apply scientific principles and in developing computer skills. Females, however, rated their development significantly higher than males did in acquiring a broad general education, ability to plan and carry out projects independently, developing good listening skills, ability to communicate ideas orally, ability to communicate ideas in writing, developing good reading comprehension skills and in understanding diverse cultures and values. No significant differences were found for ability to critically analyze events, information and ideas.
Significant differences ( p < 0.01) also were found for several goals when ethnicity was considered. In particular, African-Americans rated their development significantly higher than did Whites and Other Minorities for these goals: ability to communicate ideas in writing, ability to communicate ideas orally, developing good listening skills, developing computer skills, ability to critically analyze events, information and ideas and ability to plan and carry out projects independently.
African-American and Other Minorities rated their development
higher than did Whites on acquiring a broad general education
and understanding diverse cultures and values. African-Americans
rated their development higher in developing good reading comprehension
skills than did Whites, who in turn rated their development
higher than Other Minorities. No significant differences were
found for ability to apply mathematics skills, understanding
how science and technology influence everyday life, and ability
to apply scientific principles.
| Mean and standard deviation | |||||||
| Acquiring a broad general education | |||||||
| Ability to plan/carry out projects independently | |||||||
| Developing good listening skills | |||||||
| Ability to apply mathematics skills | |||||||
| Understand how science, technology influence life | |||||||
| Ability to critically analyze events/information/ideas |
| ||||||
| Ability to communicate ideas orally | |||||||
| Ability to communicate ideas in writing | |||||||
| Developing good reading comprehension skills | |||||||
| Ability to apply scientific principles | |||||||
| Understanding diverse cultures and values | |||||||
| Developing computer skills | |||||||
Importance of Goals
The means and standard deviations for goal importance, ranked from highest to lowest according to means for survey respondents, appear in Table 19. The rating scale used was: 5 = Very Important, 4 = Important, 3 = Moderately Important, 2 = Of Limited Importance, and 1 = Not Important. The four goals that First-Year students indicated were most important to them were: developing computer skills, acquiring a broad general education, ability to communicate ideas orally, and developing good listening skills.
Significant differences (p < 0.01) were found for many goals when gender was considered. Females rated eight goals significantly higher than did males. These were: developing computer skills, acquiring a broad general education, ability to communicate ideas orally, developing good listening skills, ability to plan and carry out projects independently, developing good reading comprehension skills, ability to communicate ideas in writing, and understanding diverse cultures and values. Males rated the importance of three goals significantly higher than did females. These were: ability to apply mathematics skills, understanding how science and technology influence everyday life and ability to apply scientific principles. There was no significant difference found for the importance of ability to critically analyze events, information and ideas when gender was considered.
Significant differences (p < 0.01) also were found
for many of the goals when ethnicity was considered. African-Americans
and Other Minorities placed greater importance than did Whites
on acquiring a broad general education, ability to apply mathematics
skills, developing computer skills and ability to critically
analyze events, information and ideas. African-Americans
placed greater importance than did Other Minorities and Whites
on ability to communicate ideas in writing, ability to communicate
ideas orally, developing good listening skills, and developing
good reading comprehension skills. African-Americans rated
understanding diverse cultures and values of higher
importance than Other Minorities, who placed more importance on
this goal than did Whites.
| Mean and standard deviation | |||||||
| Developing computer skills | |||||||
| Acquiring a broad general education | |||||||
| Ability to communicate ideas orally | |||||||
| Developing good listening skills | |||||||
| Ability to plan/carry out projects independently | |||||||
| Ability to apply mathematics skills | |||||||
| Developing good reading comprehension skills | |||||||
| Ability to communicate ideas in writing | |||||||
| Ability to critically analyze events/information/ideas |
| ||||||
| Understand how science, technology influence life | |||||||
| Ability to apply scientific principles | |||||||
| Understanding diverse cultures and values | |||||||
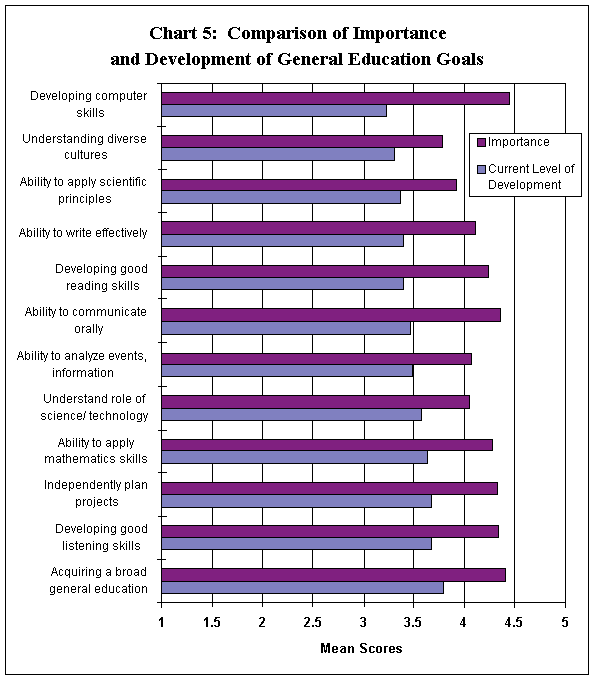
Comparison of Importance and Level of Development
Chart 5 compares the importance that respondents placed on these
goals and their perceived current level of development in each
of these areas. First-Year students rated developing computer
skills as highest in importance, but ranked it lowest in their
current level of development. Second in importance was acquiring
a broad general education, which respondents ranked highest
in current level of development.
Return to Table of Contents
Return to OIRP Survey Page
This section provides First-Year students' ratings of sixteen
goals related to student personal development. Respondents were
asked their current level of development toward these goals as
well as the importance of each goal at the time of the survey.
Level of Development
The means and standard deviations for level of development of personal development goals, ranked from highest to lowest according to means for the group, appear in Table 27. The rating scale used was: 5 = Very High, 4 = High, 3 = Average, 2 = Low, and 1 = Very Low. The personal development goals in which First-Year students indicated their highest current level of development were: taking responsibility for my own behavior, viewing learning as a lifelong process, being independent and self-reliant and ability to function as part of a team.
Significant differences (p < 0.01) were found for 12 of 16 items when gender was considered. Females rated their development in 11 of the 12 items significantly higher than did males. These included: taking responsibility for my own behavior, learning as a lifelong process, being independent and self-reliant, ability to function as part of a team, recognizing and acting upon ethical principles, understanding my own abilities and interests, clarifying personal identity, having self-discipline, improving leadership and management skills, managing my time, and being involved with public and community affairs. Males rated their development significantly higher than did females in one area: handling stress.
When ethnicity was considered, significant differences were found
for development in all of the goals, with African-Americans rating
their development in fourteen of the sixteen items significantly
higher than the other two groups. The two exceptions were: Both
African-Americans and Other Minorities rated recognizing and
acting upon ethical principles higher than did Whites; both
African-Americans and Whites rated managing my time higher
than did Other Minorities.
Importance of Goals
Significant differences ( p < 0.01) between males and
females were found when respondents were asked to rate the importance
of all 16 goals. Females rated the importance of all items significantly
higher than did males. Significant differences also were found
for the importance of goals when ethnicity was considered. Exceptions
in which no significant differences were found when ethnicity
was considered were: being independent and self-reliant, handling
stress and developing a commitment to personal health/fitness.
For each of the other 13 items, African-Americans rated the importance
of these goals significantly higher than did both Whites and Other
Minorities.
Mean and standard deviation |
All |
Female |
Male |
White | |||
| Taking responsibility for my own behavior | |||||||
| Viewing learning as a lifelong process | |||||||
| Being independent and self-reliant | |||||||
| Ability to function as part of a team | |||||||
| Understanding my own abilities and interests | |||||||
| Recognizing and action upon ethical principles | |||||||
| Realizing my potential for success | |||||||
| Clarifying personal identity | |||||||
| Having self-confidence | |||||||
| Having self-discipline | |||||||
| Coping with change | |||||||
| Developing commitment to health and fitness | |||||||
| Improving leadership and management skills | |||||||
| Handling stress | |||||||
| Managing my time | |||||||
| Being involved with public/community affairs | |||||||
Mean and standard deviation |
All |
Female |
Male |
White | |||
| Taking responsibility for my own behavior | |||||||
| Managing my time |
| ||||||
| Having self-confidence | |||||||
| Having self-discipline | |||||||
| Being independent and self-reliant | |||||||
| Realizing my potential for success | |||||||
| Handling stress | |||||||
| Understanding my own abilities and interests | |||||||
| Ability to function as part of a team | |||||||
| Improving leadership and management skills | |||||||
| Viewing learning as a lifelong process | |||||||
| Developing a commitment to health and fitness | |||||||
| Clarifying personal identity | |||||||
| Coping with change | |||||||
| Recognizing and acting on ethical principles | |||||||
| Being involved with public/community affairs | |||||||
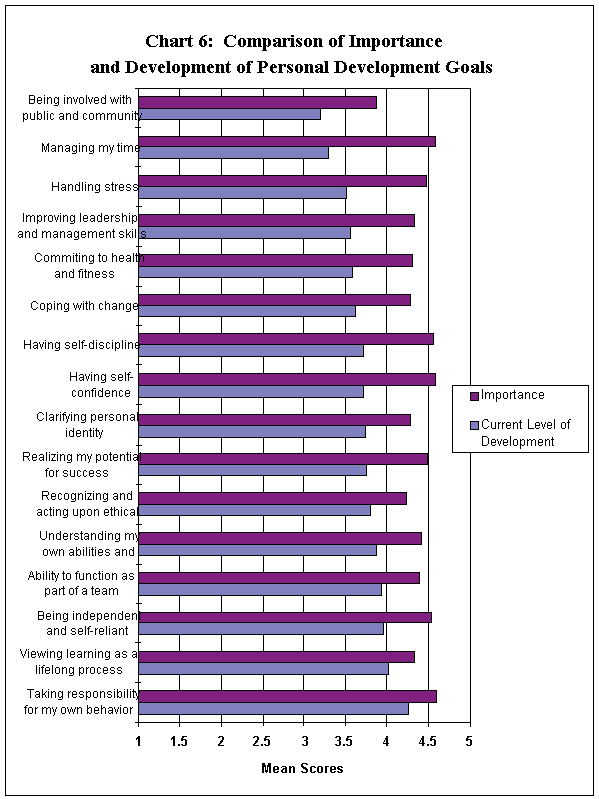
Comparison of Importance and Level of Development
Chart 6 compares the importance students placed on these goals and their perceived current level of development in these areas. First-Year students rated taking responsibility for my own behavior highest in both importance as well as current level of development.
Return to Table of Contents
Return to OIRP Survey Page
This section provides First-Year students' ratings of seven goals
related to student world view. Respondents were asked their current
level of development in these goals as well as the importance
they placed on each goal at the time of the survey.
Level of Development
Table 22 displays the means and standard deviations for level of development, ranked from highest to lowest means according to means for the total group of respondents. The rating scale used was: 5 = Very High, 4 = High, 3 = Average, 2 = Low and 1 = Very Low. The World View Goals in which First-Year students indicated their highest current level of development were: valuing racial equity, valuing gender equity and being able to interact and work with people from diverse backgrounds.
Significant differences (p < 0.01) between males and females were found for six of the seven goals. The exception was understanding issues and problems facing the world in which there were no significant differences. Females rated their level of development higher than did males in five of the six categories. The exception was understanding the present as it relates to historical events/processes. Males rated their development toward this goal significantly higher than did females.
When ethnicity was considered, significant differences were found for development toward all goals except for advancing my appreciation of the arts, music and literature. African-Americans rated their current level of development toward four of the six goals higher than did both Whites and Other Minorities. These included: understanding issues and problems facing the world, understanding the present as it relates to historical events/processes, having a tolerance for different points of view and valuing gender equity.
Significant differences between all three groups were found for
two goals. African-Americans rated their development toward being
able to interact and work with people from diverse backgrounds
as well as valuing racial equity significantly higher than
Other Minorities, who in turn rated their development significantly
higher than did Whites.
Importance of Goals
Table 23 displays the means and standard deviations for goal importance, ranked from highest to lowest means for the total group of respondents. The rating scale used was: 5 = Very Important, 4 = Important, 3 = Moderately Important, 2 = Of Limited Importance, and 1 = Not Important. The World View Goals that First-Year students indicated were most important to them were: valuing racial equity, having a tolerance for different points of view, and valuing gender equity.
Significant differences (p < 0.01) between males and females about the importance of goals were found for six of the seven goals. No significant difference between males or females was found for the goal of understanding the present as it relates to historical events/processes. Females rated the importance of the other six goals significantly higher than did males.
Among ethnic groups, significant differences (p < 0.01)
were found for all goals except advancing my appreciation of
the arts, music and literature. African-Americans rated five
of the remaining six items higher than did Whites or Other Minorities.
These included: understanding issues and problems facing
the world, understanding the present as it relates to historical
events/processes, being able to interact and work with people
from diverse backgrounds, valuing gender equity and valuing
racial equity. Both African-Americans and Other Minorities
rated having a tolerance for different points of view higher
than did Whites.
Mean and standard deviation | |||||||
| Valuing racial equity | |||||||
| Valuing gender equity | |||||||
| Interact/work with people with diverse backgrounds | |||||||
| Having a tolerance for difference points of view | |||||||
| Appreciation of the arts/music/literature | |||||||
| Understanding issues and problems facing the world | |||||||
| Understanding the present as it relates to history | |||||||
Mean and standard deviation | |||||||
| Valuing racial equity | |||||||
| Having a tolerance for different points of view | |||||||
| Valuing gender equity | |||||||
| Interact/work with people from diverse backgrounds | |||||||
| Understanding issues and problems facing world | |||||||
| Understanding the present as it relates to history | |||||||
| Appreciation of the arts/music/literature | |||||||
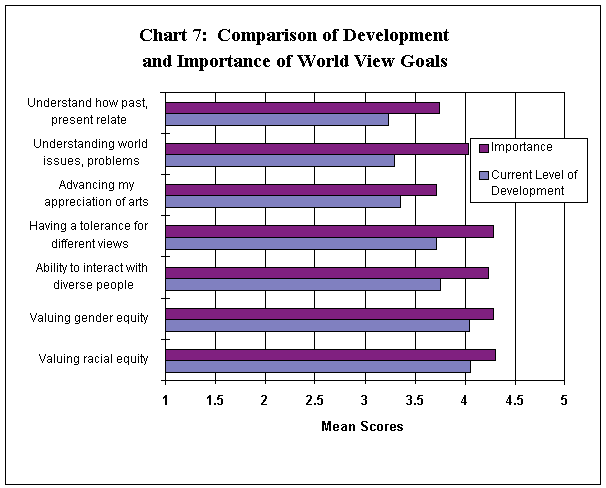
Comparison of Importance and Level of Development
Chart 7 compares the level of student development toward World View Goals and the importance they place on these goals. It is interesting to note that although First-Year students rated the four diversity-related goals (valuing racial equity, having a tolerance for different points of view, valuing gender equity, and being able to interact and work with people from diverse backgrounds) as most important. They rated their development in these four goals generally lower.
Return to Table of Contents
Return to OIRP Survey Page
This section presents responses to questions asking First-Year
students about their interest in participating in co-curricular
programs and activities at NC State.
Student Affairs
First-Year students were asked to indicate their interest in 26 programs and activities. Table 24 presents the percentage of respondents interested in each program or activity, in decreasing percentage order. The highest percentage of all respondents indicated an interest in the following programs or activities: intramurals (52%), social fraternity/sorority (40%), co-op program (36%) and outdoor adventure (35%).
There were significant differences (p<0.01) between males and females for 23 of the 26 programs and activities. Non-significant differences were found for the co-op program, Student Judicial Board and music minor, bands, choirs, orchestras, chamber music, bagpipes, drums..
In general, a larger percentage of males than females expressed interest in intramurals, outdoor adventure, indoor recreation, informal recreation and ROTC. A significantly larger number of females, however, were more interested than males in receiving information about programs and activities concerning social fraternities/ sororities, fitness, volunteer services, study abroad, club sports, student government, attending theater as audience, Leadership Development Program, student publications, performing arts selection, attending art museums, Union Activities Board, performing in theater, healthy lifestyle issues, student dance companies, gender issues, crafts, and programs/services for families and children.
Significant differences (p<0.01) also were found among the three ethnic groups for 19 of the 26 programs and activities. When ethnicity was considered, there were no significant differences for interest expressed in these programs and activities: fitness, attending theater as audience, indoor recreation, student publications/media, attending art exhibitions, performing in theater and crafts program.
In general, a larger percentage of African-Americans than Whites and Other Minorities showed interest in these programs and activities: social fraternity/sorority, student government, music as a minor, Leadership Development Program, performing arts selection, Union Activities Board, healthy lifestyle issues, student dance companies, gender issues, ROTC, and the Student Judicial Board. A larger percentage of both African-Americans and Other Minorities showed greater interest than Whites in the co-op program and volunteer services.
A larger percentage of Whites than African-Americans or Other
Minorities expressed interest in intramurals and outdoor
adventure and informal recreation while a larger percentage
of Other Minorities than African-Americans and Whites expressed
greater interest in study abroad, club sports and programs
and services for children and families.
| Interest in program or activity (%) | |||||||
| Intramurals | + ++ | ||||||
| Social fraternity/sorority | + ++ | ||||||
| Co-op program | ++ | ||||||
| Outdoor adventure | + ++ | ||||||
| Fitness | + | ||||||
| Volunteer services | + ++ | ||||||
| Study abroad | + ++ | ||||||
| Club sports | + ++ | ||||||
| Student government | + ++ | ||||||
| Attending theater | + | ||||||
| Indoor recreation | + | ||||||
| Music minor | ++ | ||||||
| Leadership Development Program |
+ ++ | ||||||
| Student publications/media | + |
|
|
|
|
| |
| Performing arts selection | + ++ | ||||||
| Informal recreation | + ++ | ||||||
| Attending art exhibitions | + | ||||||
| Union Activities Board | + ++ | ||||||
| Performing in theater | + | ||||||
| Healthy lifestyles | + ++ | ||||||
| Performing dance | + ++ | ||||||
| Gender issues | + ++ | ||||||
| ROTC | + ++ | ||||||
| Student judicial board | ++ | ||||||
| Crafts program | + | ||||||
| Programs/services for children/families | + ++ |
ROTC
First-year students were asked two questions about ROTC participation. Responses appear in Tables 25 and 26. Of all students, 3% of First-Year respondents indicated that they had ROTC training before enrolling at NC State. Significant differences were found when both gender (p=0.004) and race (p=0.001) were considered. A significantly larger percentage of males (3%) than females (2%) indicated that they had some ROTC training before enrolling at NC State.
Among ethnic groups, a significantly larger percentage of African-Americans (8%) had ROTC training before enrolling at NC State than did either Whites (2%) or Other Minorities (2%).
Of all First-Year students, 5% indicated that they planned to
enroll in ROTC at NC State. Significant differences (p=0.001)
were found when both gender and race were considered. A significantly
higher percentage of males (6%) than females (3%) indicated they
would enroll in ROTC, while a significantly higher percentage
of African-Americans (11%) than those in the other two ethnic
groups (Whites, 4%; Other Minorities, 5%) indicated they would
enroll.
| Highest level of ROTC training received (%) | ||||||
| None | ||||||
| High school ROTC | ||||||
| College ROTC |
| Plan to enroll in ROTC (%) | ||||||
| Yes | ||||||
| No |
Religion
First-Year students were asked to choose their religious preferences from a list of 14, which also included listings for both "other" and "no preference" (see Table 27). The data in Table 27 show that the highest percentage of all students indicated their preference was Baptist (29%), followed by Methodist (15%) and no preference (14%). Twenty-three percent listed either "other" or "no preference." No significant differences were found when gender was considered.
Significant differences (p=0.001) were found, however, when ethnicity
was considered. A larger percentage, which included a majority,
of African-Americans listed their religious preference as Baptist
(56%) compared to Whites (27%) and Other Minorities (11%). Fifty
percent of Other Minorities listed their preference as either
"no preference" or "other" compared to 27%
of African-Americans and 21% of Whites.
Religious preference (%) | ||||||
| Baptist | ||||||
| Methodist | ||||||
| No preference | ||||||
| Catholic | ||||||
| Other | ||||||
| Presbyterian | ||||||
| Episcopal | ||||||
| Lutheran | ||||||
| Disciples of Christ | ||||||
| Latter-Day Saints | ||||||
| Jewish | ||||||
| Moravian | ||||||
| Islamic | ||||||
| Unitarian |
Musical Instruments
First-Year students were asked to indicate whether they played
any of the instruments from a list of nine. Only a small percentage
of students responded 'yes' to these questions (see Table 28).
The highest percentage (9%) responded that they played clarinet/saxophone.
Play instrument (%) | ||||||
| Clarinet/saxophone | ||||||
| Fr.horn/trumpet/coronet | ||||||
| Flute/piccolo | ||||||
| Trombone/baritone/ euphonium/tuba |
||||||
| Mallets/percussion | ||||||
| Viola/violin | ||||||
| Oboe/bassoon | ||||||
| Cello/double bass | ||||||
| Bagpipes |
Return to Table of Contents
Return to OIRP Survey Page
This section presents background information about First-Year
students, including whether they receive financial aid, information
about their households, employment plans, and other personal information.
Financial Aid
The percentages of respondents who indicated they will receive various types of financial aid appear in Table 29. Of those who said they would receive aid, 31% indicated they would receive aid based upon financial need and 28% said that they would receive academic aid. A significantly larger percentage of females than males indicated that they would receive aid based on financial need (p=0.002) and/or academic aid (p=0.006). When ethnicity was considered, significant differences were found for academic aid (p=0.001), aid based on financial need (p=0.001) and for other kinds of aid (p=0.002). A larger percentage of African-Americans (61%) than Other Minorities (38%) and Whites (27%) said they would receive financial aid based upon need. As well, a larger percentage of African-Americans (44%) than Other Minorities (29%) and Whites (26%) indicated they would receive academic aid.
Of the 2,766 First-Year students who answered the question, 38%
indicated they would receive no aid. Of this percentage, 15%
were female and 24% were male; 36% were White, 2% were Other Minorities
and 1% were African-American.
Basis of aid (%) | |||||||
| Financial need | + ++ | ||||||
| Academic | + ++ | ||||||
| Other than listed | ++ | ||||||
| Athletic-based | |||||||
| Other (dance, music, etc.) |
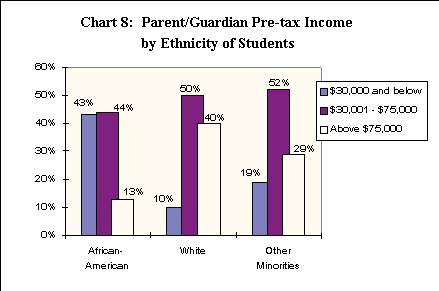
Parent/Guardian Income
First-Year students were asked about the income of their parents/guardians. Of all respondents, 49% reported that the 1995 pre-tax income of either their parents or guardians was within a $30,001 to $75,000 range compared to 14% in the below-$30,001 range and 37% in the above-$75,000 range (see Table 30). Significant differences were found among ethnic groups (p=0.001), but not when gender was considered.
Of those in the below-$30,001 range, 43% were African-Americans,
19% were Other Minorities and 10% were White. Of those who fell
in the $30,001-to-$75,000 range, 50% were White compared to 44%
who were African-American and 52% who were Other Minorities.
Of those who fell in the top income range (more than $75,000 per
year) 40% were White, 29% were Other Minorities and 13% were
African-American (see Chart 8).
Parent/guardian income (%) | ||||||
| $10,000 or less | ||||||
| $10,001-$15,000 | ||||||
| $15,001-$20,000 | ||||||
| $20,001-$25,000 | ||||||
| $25,001-$30,000 | ||||||
| $30,001-$35,000 | ||||||
| $35,001-$40,000 | ||||||
| $40,001-$50,000 | ||||||
| $50,001-$60,000 | ||||||
| $60,001-$75,000 | ||||||
| $75,001-$100,000 | ||||||
| $100,001-$150,000 | ||||||
| $150,001-$200,000 | ||||||
| $200,000 plus |
Parent/Guardian Education
Tables 31 and 32 provide the responses to questions about education levels for the father/male guardian and mother/female guardian of First-Year students.
Eighty-three percent of all First-Year students reported that
their father/male guardian had at least some college. Similarly,
79% of all First-Year students indicated that their mother/female
guardian had at least some college.
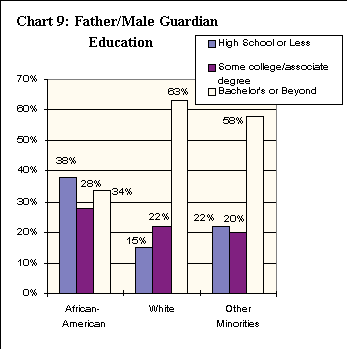
For father/male guardian's education, a significant difference
was found among ethnic groups (p=0.001), but not when gender was
considered. A larger percentage of African-Americans (38%) than
Other Minorities (22%) or Whites (15%) indicated that their father/male
guardian had received a high school education or less. A larger
percentage of Whites (63%) than Other Minorities (58%) and African-Americans
(34%) indicated that their father/male guardian held a bachelor's
degree or had received education beyond a bachelor's degree (see
Table 31).
| Father/male guardian education (%) |
| |||||
| Less than high school | ||||||
| High school graduate | ||||||
| Some college/no degree | ||||||
| 2- yr. associate degree | ||||||
| 4-year baccalaureate degree | ||||||
| Some graduate or prof. coursework/no degree |
| |||||
| Master's degree | ||||||
| Doctorate or other professional degree |
Similarly, for mother/female guardian's education, significant
differences were found among ethnic groups (p=0.001), but not
when gender was considered.
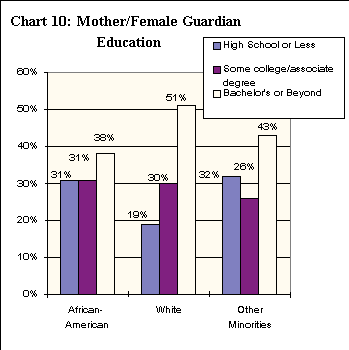
A larger percentage of Other Minorities (32%) than African-Americans (31%) and Whites (19%) indicated their mother/female guardian had received a high school education or less.
A larger percentage of Whites (51%) than Other Minorities (43%)
or African-Americans (38%) indicated that their mother/female
guardian held a bachelor's degree or had received education beyond
a bachelor's degree (see Table 32).
| Mother/female guardian education (%) |
| |||||
| Less than high school | ||||||
| High school grad | ||||||
| Some college/no degree | ||||||
| 2 yr. associate degree | ||||||
| 4-year baccalaureate degree | ||||||
| Some graduate or prof. coursework/no degree | ||||||
| Master's degree | ||||||
| Doctorate or other professional degree |
|
Household Information
Tables 33 and 34 give information about the households established by parents/guardians of First-Year students. Sixty-two percent of survey respondents indicated they came from households with four or more persons (see Table 35). Significant differences (p = 0.009) were found when gender was considered, with a larger percentage of males (17%) than females (13%) indicating they came from households of two or fewer persons. Similarly, significant differences (p = 0.008) were found among ethnic groups. A larger percentage of African-American (19%) than White (15%) and Other Minorities (14%) indicated they lived in households supporting either one or two persons.
Sixty-eight percent of First-Year students indicated they were
the only dependent in their family household who was enrolled
in college at the time of the survey (see Table 34). No significant
differences were found when ethnicity or gender were considered.
| Number supported in household (%) | ||||||
| One | ||||||
| Two | ||||||
| Three | ||||||
| Four | ||||||
| Five or more |
| Number of college dependents (%) | ||||||
| Only self | ||||||
| Two | ||||||
| Three or more |
Home Community
Table 35 and Chart 11 show the responses of First-Year students who were asked to indicate the type of home community in which they lived during high school.
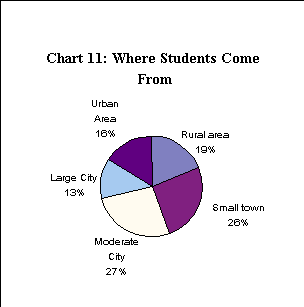
Forty-four percent of respondents indicated that they lived either in a small town (20,000 or less) or rural area.
Twenty-nine percent indicated they came from either a large city (60,000 - 100,000) or an urban area (over 100,000).
Significant differences were found when gender (p = 0.001) and
ethnicity (p = 0.001) were considered. A larger percentage of
males (21%) than females (16%) said they were from rural areas,
while a smaller percentage of Other Minorities (10%) than Whites
(20%) and African-American (19%) came from rural areas.
| Area lived during high school (%) | ||||||
| Rural area | ||||||
| Small town | ||||||
| Moderate city | ||||||
| Large city | ||||||
| Urban area |
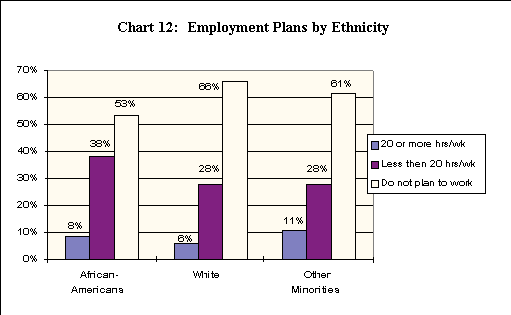
Employment Plans
First-Year students were asked two questions about their employment
plans during the first semester. The data in Table 36 reveal
that 64% of respondents said they did not plan to work during
their first semester. Significant differences (p=0.001) were
found among ethnic groups, but not when gender was considered.
A larger percentage of Whites (66%) than Other Minorities (61%)
and African-American (53%) indicated they did not plan to work
during their first semester. Chart 12 shows employment plans
of students according to ethnicity.
| Employment during first semester (%) | ||||||
| 20 or more hrs/wk | ||||||
| Less than 20 hrs/wk | ||||||
| Do not plan to work |
Personal Information
First-Year students were asked whether they had dependent
children. Almost all (97%) reported having no dependent children (see Table 37).
Significant differences (p = 0.002), however, were found when ethnicity was considered.
A larger percentage of African-American (5%) than Whites (3%)
and Other Minorities (3%) indicated they had at least one dependent
child. Table 38 presents the ages of children of First-Year students.
| Number dependent children (%) |
| |||||
| None | ||||||
| One | ||||||
| Two | ||||||
| Three or more |
| Ages of dependent children (number) | ||||||
| Infant | ||||||
| Elementary school | ||||||
| Secondary | ||||||
| 18 years and older |
Respondents were asked to indicate whether they had any of seven disabilities that were listed. Table 39 presents a breakdown of disabilities.
|
Type of disability (%) | ||||||
| Learning disorder/Attention Deficit Disorder |
|
|
|
| ||
| Other | ||||||
| Legally blind | ||||||
| Hard of hearing/deaf | ||||||
| Mobility impairment | ||||||
| Traumatic head injury | ||||||
| Psychological |
Return to Table of Contents
Return to OIRP Survey Page
NC State's undergraduate offerings fall into eleven academic
units: College of Agriculture and Life Sciences - Bachelor's
(CALS), Agricultural Institute - two-year (AGIN), School of Design
(Design), College of Education and Psychology (CEP), College of
Engineering (COE), First Year College (FYC), College of Forest
Resources (CFR), College of Humanities and Social Sciences (CHASS),
College of Management (COM), College of Physical and Mathematical
Sciences (PAMS), and College of Textiles (COT). This section
provides responses to selected questions from First-Year students
who enrolled in these academic units. Additional responses for
the Marketing Research questions are found in Section II.
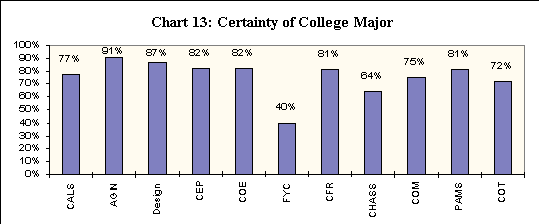
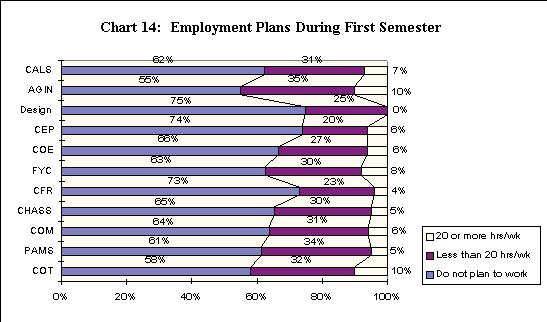
Academic Unit Summary:
Chart 13 presents the percentage of respondents in each academic
unit who said they were certain (very certain or certain) of their
college major. Chart 14 presents a breakdown of first-semester
employment plans of First-Year students by academic unit.
Return to Table of Contents
Return to OIRP Survey Page
Return to OIRP Home Page